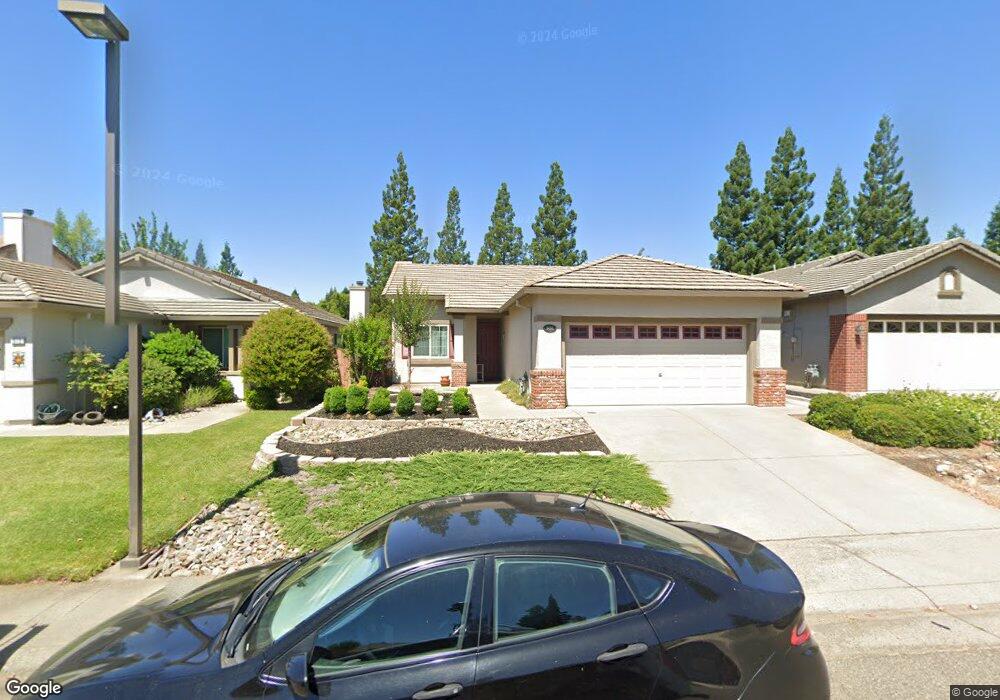
908 Rathbone Cir Folsom, CA 95630
Broadstone NeighborhoodEstimated Value: $567,000 - $689,000
3
Beds
2
Baths
1,313
Sq Ft
$476/Sq Ft
Est. Value
About This Home
This home is located at 908 Rathbone Cir, Folsom, CA 95630 and is currently estimated at $625,062, approximately $476 per square foot. 908 Rathbone Cir is a home located in Sacramento County with nearby schools including Gold Ridge Elementary School, Sutter Middle School, and Folsom High School.
Ownership History
Date
Name
Owned For
Owner Type
Purchase Details
Closed on
Sep 9, 2010
Sold by
Belden Steve and Belden Regina
Bought by
Belden Steven C and Belden Regina A
Current Estimated Value
Purchase Details
Closed on
Aug 27, 2007
Sold by
Eckhardt Mathew and Eckhardt Tammy
Bought by
Belden Steve and Belden Regina
Home Financials for this Owner
Home Financials are based on the most recent Mortgage that was taken out on this home.
Original Mortgage
$304,000
Outstanding Balance
$193,456
Interest Rate
6.67%
Mortgage Type
Purchase Money Mortgage
Estimated Equity
$431,606
Purchase Details
Closed on
Aug 31, 2004
Sold by
Hughes Rebecca Iona and Rebecca Iona Hughes Revocable
Bought by
Eckhardt Mathew and Barnett Tammy
Home Financials for this Owner
Home Financials are based on the most recent Mortgage that was taken out on this home.
Original Mortgage
$40,100
Interest Rate
5.94%
Mortgage Type
Stand Alone Second
Purchase Details
Closed on
Sep 19, 2002
Sold by
Hughes Rebecca Iona
Bought by
Hughes Rebecca Iona and Rebecca Iona Hughes Revocable
Purchase Details
Closed on
Jul 11, 2002
Sold by
Thelen Deloris
Bought by
Hughes Rebecca Iona
Home Financials for this Owner
Home Financials are based on the most recent Mortgage that was taken out on this home.
Original Mortgage
$102,000
Interest Rate
6.69%
Purchase Details
Closed on
Mar 26, 1999
Sold by
Bakunin Charles B and Bakunin Allison N
Bought by
Thelen Deloris
Home Financials for this Owner
Home Financials are based on the most recent Mortgage that was taken out on this home.
Original Mortgage
$166,209
Interest Rate
6.79%
Mortgage Type
VA
Purchase Details
Closed on
Oct 23, 1998
Sold by
Bakunin Charles B and Bakunin Allison N
Bought by
Bakunin Charles B and Bakunin Allison N
Home Financials for this Owner
Home Financials are based on the most recent Mortgage that was taken out on this home.
Original Mortgage
$115,000
Interest Rate
6.6%
Purchase Details
Closed on
Sep 9, 1998
Sold by
Bakunin Charles B
Bought by
Bakunin Charles and Bakunin Allison
Home Financials for this Owner
Home Financials are based on the most recent Mortgage that was taken out on this home.
Original Mortgage
$115,000
Interest Rate
6.6%
Purchase Details
Closed on
Apr 18, 1997
Sold by
Elliott Homes Inc
Bought by
Bakunin Charles B
Home Financials for this Owner
Home Financials are based on the most recent Mortgage that was taken out on this home.
Original Mortgage
$129,600
Interest Rate
7.86%
Create a Home Valuation Report for This Property
The Home Valuation Report is an in-depth analysis detailing your home's value as well as a comparison with similar homes in the area
Home Values in the Area
Average Home Value in this Area
Purchase History
| Date | Buyer | Sale Price | Title Company |
|---|---|---|---|
| Belden Steven C | -- | None Available | |
| Belden Steve | $380,000 | Placer Title Company | |
| Eckhardt Mathew | $401,000 | Placer Title Company | |
| Hughes Rebecca Iona | -- | -- | |
| Hughes Rebecca Iona | $252,000 | Placer Title Company | |
| Thelen Deloris | $163,000 | Old Republic Title Company | |
| Bakunin Charles B | -- | Financial Title Company | |
| Bakunin Charles | -- | Chicago Title Co | |
| Bakunin Charles B | $136,500 | Stewart Title |
Source: Public Records
Mortgage History
| Date | Status | Borrower | Loan Amount |
|---|---|---|---|
| Open | Belden Steve | $304,000 | |
| Previous Owner | Eckhardt Mathew | $40,100 | |
| Previous Owner | Eckhardt Mathew | $320,800 | |
| Previous Owner | Hughes Rebecca Iona | $102,000 | |
| Previous Owner | Thelen Deloris | $166,209 | |
| Previous Owner | Bakunin Charles B | $115,000 | |
| Previous Owner | Bakunin Charles | $115,000 | |
| Previous Owner | Bakunin Charles B | $129,600 |
Source: Public Records
Tax History
| Year | Tax Paid | Tax Assessment Tax Assessment Total Assessment is a certain percentage of the fair market value that is determined by local assessors to be the total taxable value of land and additions on the property. | Land | Improvement |
|---|---|---|---|---|
| 2025 | $5,537 | $499,121 | $229,859 | $269,262 |
| 2024 | $5,537 | $489,335 | $225,352 | $263,983 |
| 2023 | $5,442 | $479,741 | $220,934 | $258,807 |
| 2022 | $5,364 | $470,335 | $216,602 | $253,733 |
| 2021 | $5,294 | $461,113 | $212,355 | $248,758 |
| 2020 | $5,845 | $456,386 | $210,178 | $246,208 |
| 2019 | $5,905 | $447,438 | $206,057 | $241,381 |
| 2018 | $5,793 | $438,666 | $202,017 | $236,649 |
| 2017 | $5,472 | $430,065 | $198,056 | $232,009 |
| 2016 | $5,518 | $407,480 | $187,655 | $219,825 |
| 2015 | $5,139 | $380,823 | $175,379 | $205,444 |
| 2014 | $4,800 | $373,356 | $171,940 | $201,416 |
Source: Public Records
Map
Nearby Homes
- 853 Rathbone Cir
- 300 Sprig Cir
- 1212 Vessona Cir Unit 1212
- 1415 Vessona Cir Unit 1415
- 885 Halidon Way Unit 314
- 885 Halidon Way Unit 923
- 1154 Knopfler Cir
- 1203 Halidon Way
- 1384 Walden Dr
- 1364 Copping Ct
- 931 Willow Bridge Dr
- 894 Blossom Rock Ln
- 968 Carter St
- 939 Mcguire Ct
- 114 Barnhill Dr
- 301 Russi Ct
- 87 Sluice Way
- 102 Moylan Way
- 301 Blossom Rock Ln Unit 53
- 611 Rogers Cir
- 912 Rathbone Cir
- 906 Rathbone Cir
- 916 Rathbone Cir
- 902 Rathbone Cir
- 920 Rathbone Cir
- 888 Rathbone Cir
- 911 Rathbone Cir
- 907 Rathbone Cir
- 915 Rathbone Cir
- 903 Rathbone Cir
- 884 Rathbone Cir
- 919 Rathbone Cir
- 924 Rathbone Cir
- 889 Rathbone Cir
- 923 Rathbone Cir
- 880 Rathbone Cir
- 2265 Argent Ct
- 928 Rathbone Cir
- 2137 Entwistle Ct
- 881 Rathbone Cir
Your Personal Tour Guide
Ask me questions while you tour the home.