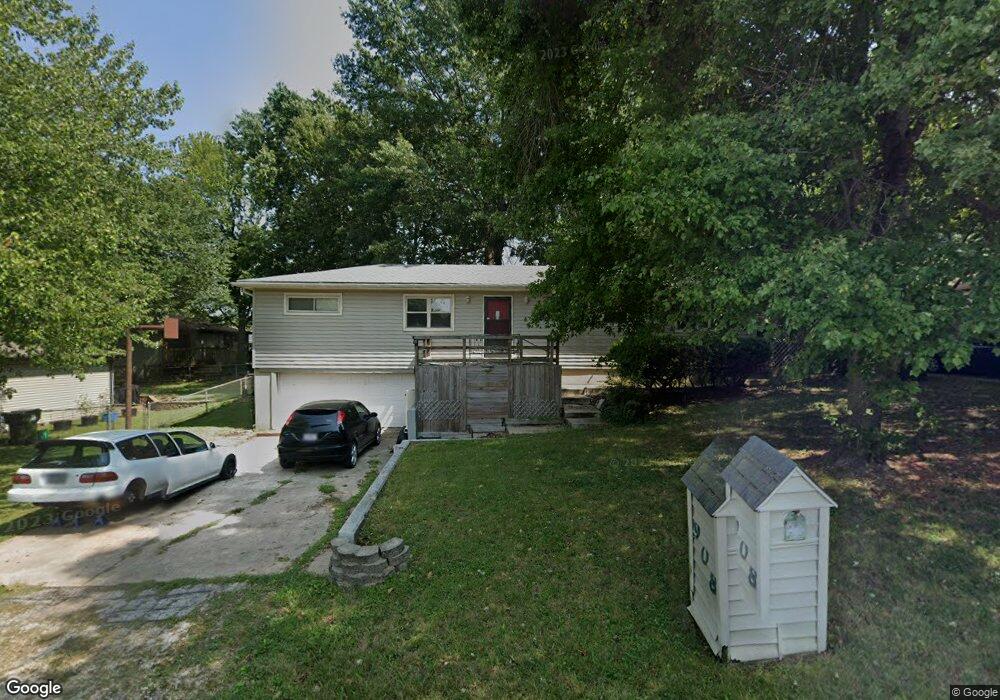
908 Tyler St Unit 1311093 Aurora, MO 65605
Estimated Value: $175,000 - $193,625
3
Beds
3
Baths
1,320
Sq Ft
$140/Sq Ft
Est. Value
About This Home
This home is located at 908 Tyler St Unit 1311093, Aurora, MO 65605 and is currently estimated at $185,406, approximately $140 per square foot. 908 Tyler St Unit 1311093 is a home located in Lawrence County with nearby schools including Pate Early Childhood Center, Robinson Intermediate School, and Robinson Elementary School.
Ownership History
Date
Name
Owned For
Owner Type
Purchase Details
Closed on
Oct 2, 2025
Sold by
Mesa Zane and Mesa Demitria
Bought by
Pendleton Austin Levi
Current Estimated Value
Home Financials for this Owner
Home Financials are based on the most recent Mortgage that was taken out on this home.
Original Mortgage
$184,103
Outstanding Balance
$184,103
Interest Rate
6.56%
Mortgage Type
FHA
Estimated Equity
$1,303
Purchase Details
Closed on
Sep 30, 2016
Sold by
Wise Larry E and Wise Jerrie
Bought by
Mesa Shawn
Home Financials for this Owner
Home Financials are based on the most recent Mortgage that was taken out on this home.
Original Mortgage
$94,601
Interest Rate
3.43%
Mortgage Type
New Conventional
Purchase Details
Closed on
Apr 15, 2015
Sold by
Jpmorgan Chase Bank Na
Bought by
Wise Larry
Purchase Details
Closed on
May 31, 2013
Sold by
Korver Kent and Korver Shari
Bought by
Jpmorgan Chase Bank Na
Purchase Details
Closed on
Feb 12, 2009
Sold by
Smith Ronald L and Smith Cheryl A
Bought by
Korver Kent
Home Financials for this Owner
Home Financials are based on the most recent Mortgage that was taken out on this home.
Original Mortgage
$91,734
Interest Rate
4.92%
Create a Home Valuation Report for This Property
The Home Valuation Report is an in-depth analysis detailing your home's value as well as a comparison with similar homes in the area
Home Values in the Area
Average Home Value in this Area
Purchase History
| Date | Buyer | Sale Price | Title Company |
|---|---|---|---|
| Pendleton Austin Levi | -- | None Listed On Document | |
| Mesa Shawn | -- | None Available | |
| Wise Larry | -- | None Available | |
| Jpmorgan Chase Bank Na | $56,950 | None Available | |
| Korver Kent | -- | -- | |
| Korver Kent | -- | None Available |
Source: Public Records
Mortgage History
| Date | Status | Borrower | Loan Amount |
|---|---|---|---|
| Open | Pendleton Austin Levi | $184,103 | |
| Previous Owner | Mesa Shawn | $94,601 | |
| Previous Owner | Korver Kent | $91,734 |
Source: Public Records
Tax History Compared to Growth
Tax History
| Year | Tax Paid | Tax Assessment Tax Assessment Total Assessment is a certain percentage of the fair market value that is determined by local assessors to be the total taxable value of land and additions on the property. | Land | Improvement |
|---|---|---|---|---|
| 2025 | $900 | $17,990 | $2,220 | $15,770 |
| 2024 | $829 | $16,430 | $2,220 | $14,210 |
| 2023 | $824 | $16,430 | $2,220 | $14,210 |
| 2022 | $773 | $15,410 | $2,220 | $13,190 |
| 2021 | $774 | $15,410 | $2,220 | $13,190 |
| 2020 | $746 | $14,730 | $1,540 | $13,190 |
| 2019 | $734 | $14,730 | $1,540 | $13,190 |
| 2018 | $733 | $14,730 | $1,540 | $13,190 |
| 2017 | $729 | $14,730 | $1,540 | $13,190 |
| 2016 | -- | $13,430 | $1,540 | $11,890 |
| 2015 | -- | $13,430 | $1,540 | $11,890 |
| 2014 | -- | $13,430 | $1,540 | $11,890 |
Source: Public Records
Map
Nearby Homes
- 906 W Pearl St
- 1006 Baretta Ct
- 1220 Tyler St
- 667 W Elm St
- 1301 S Tyler Ave
- 923 Rosemary Ave
- 1019 Daniels St
- 611 S Harrison Ave
- 314 Jasper St
- 1705 S Tyler Ave
- 504 S Lincoln Ave
- 1100 Chicory Ln
- 221 W South St
- 308 W Church St
- 1101 Highland Dr
- 213 Jasper St
- 421 W College St
- 1813 Edgewood Dr
- 1307 S Washington Ave
- 23 W Anderson St
- 910 Tyler St
- 900 S Tyler Ave
- 910 S Tyler Ave
- 830 W Springfield St
- 900 Tyler St
- 911 Oak Ridge Dr
- 907 S Tyler Ave
- 907 Tyler St
- 907 Oak Ridge Dr
- 1002 Tyler St
- 903 Tyler St
- 820 W Springfield St
- 1003 Oak Ridge Dr
- 900 W Pearl St
- 1008 S Tyler Ave
- 1007 Oak Ridge Dr
- 908 Oak Ridge Dr
- 930 W Springfield St
- 915 W Pearl St
- 904 Oak Ridge Dr Unit 60002265