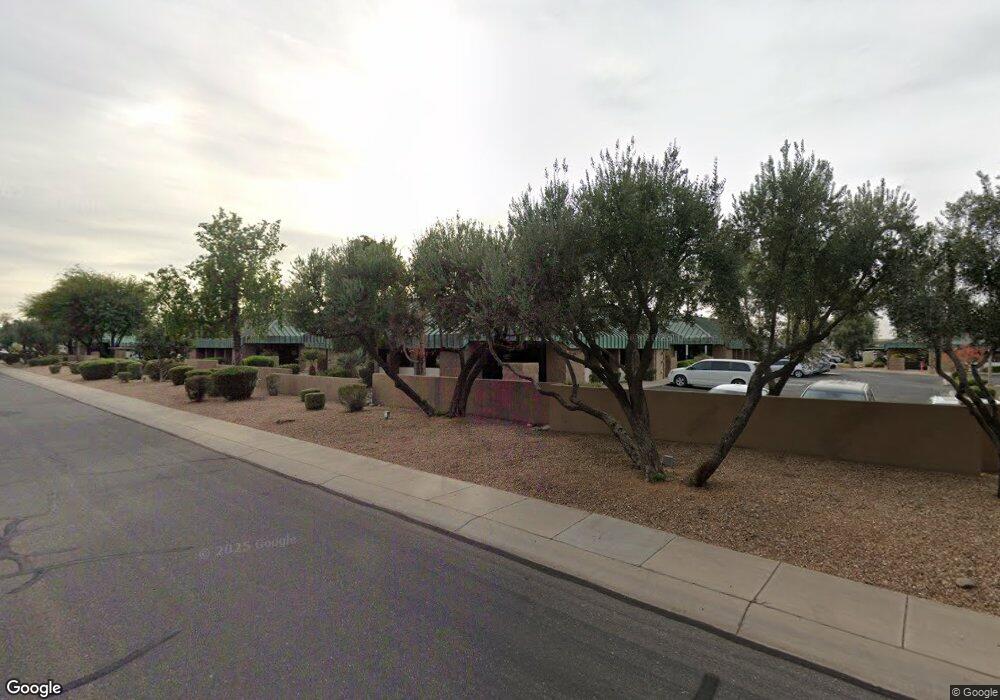
908 W Chandler Blvd Unit Bldg A Chandler, AZ 85225
Downtown Chandler NeighborhoodEstimated Value: $763,896
--
Bed
--
Bath
3,453
Sq Ft
$221/Sq Ft
Est. Value
About This Home
This home is located at 908 W Chandler Blvd Unit Bldg A, Chandler, AZ 85225 and is currently estimated at $763,896, approximately $221 per square foot. 908 W Chandler Blvd Unit Bldg A is a home located in Maricopa County with nearby schools including Hartford Sylvia Encinas Elementary School, Chandler High School, and Andersen Junior High School.
Ownership History
Date
Name
Owned For
Owner Type
Purchase Details
Closed on
Feb 1, 2019
Sold by
Resolution Fund Management Llc
Bought by
Chandana Real Estate Llc
Current Estimated Value
Home Financials for this Owner
Home Financials are based on the most recent Mortgage that was taken out on this home.
Original Mortgage
$384,000
Outstanding Balance
$337,605
Interest Rate
4.5%
Mortgage Type
Commercial
Estimated Equity
$437,611
Purchase Details
Closed on
May 11, 2018
Sold by
De Victoria Llc
Bought by
Resolution Fund Management Llc
Purchase Details
Closed on
May 9, 2008
Sold by
Devictoria Pamela
Bought by
Devictoria Llc
Create a Home Valuation Report for This Property
The Home Valuation Report is an in-depth analysis detailing your home's value as well as a comparison with similar homes in the area
Home Values in the Area
Average Home Value in this Area
Purchase History
| Date | Buyer | Sale Price | Title Company |
|---|---|---|---|
| Chandana Real Estate Llc | $480,000 | Premier Title Agency | |
| Resolution Fund Management Llc | -- | Commonwealth Title | |
| Devictoria Llc | -- | None Available |
Source: Public Records
Mortgage History
| Date | Status | Borrower | Loan Amount |
|---|---|---|---|
| Open | Chandana Real Estate Llc | $384,000 |
Source: Public Records
Tax History Compared to Growth
Tax History
| Year | Tax Paid | Tax Assessment Tax Assessment Total Assessment is a certain percentage of the fair market value that is determined by local assessors to be the total taxable value of land and additions on the property. | Land | Improvement |
|---|---|---|---|---|
| 2025 | $7,159 | $76,569 | -- | -- |
| 2024 | $7,342 | $75,201 | -- | -- |
| 2023 | $7,342 | $127,517 | $47,090 | $80,427 |
| 2022 | $7,319 | $113,085 | $31,570 | $81,515 |
| 2021 | $7,738 | $104,238 | $32,472 | $71,766 |
| 2020 | $7,695 | $94,536 | $32,454 | $62,082 |
| 2019 | $7,425 | $80,046 | $31,482 | $48,564 |
| 2018 | $7,214 | $68,310 | $22,554 | $45,756 |
| 2017 | $6,777 | $62,460 | $18,468 | $43,992 |
| 2016 | $6,546 | $55,746 | $16,488 | $39,258 |
| 2015 | $6,451 | $56,962 | $10,675 | $46,287 |
Source: Public Records
Map
Nearby Homes
- 337 N Comanche Dr
- 524 N Beverly St
- 537 N Jay St
- 568 N Emerson St
- 490 N Vine St
- 518 N Cheri Lynn Dr
- 515 W Toledo St
- 1293 W Toledo St
- 624 N Vine St
- 625 N Vine St
- 1152 W Cindy St
- 651 W Laredo St
- 670 W Laredo St
- 630 W Laredo St
- 847 W Harrison St
- 815 N Evergreen St
- 843 N Jay St
- 1601 W Oakland St
- 333 N Pennington Dr Unit 15
- 1340 W Elgin St
- 908 W Chandler Blvd Unit D
- 908 W Chandler Blvd Unit B-3
- 908 W Chandler Blvd
- 908 W Chandler Blvd Unit B-4
- 908 W Chandler Blvd Unit C8
- 912 W Chandler Blvd
- 810 W Toledo St
- 809 W Toledo St
- 941 W Detroit St
- 921 W Detroit St
- 900 W Chandler Blvd Unit A-6
- 961 W Detroit St
- 901 W Detroit St
- 809 W Detroit St
- 225 N Pleasant Dr Unit 23
- 225 N Pleasant Dr Unit 8
- 225 N Pleasant Dr Unit 18
- 225 N Pleasant Dr
- 225 N Pleasant Dr Unit 30
- 225 N Pleasant Dr Unit 27