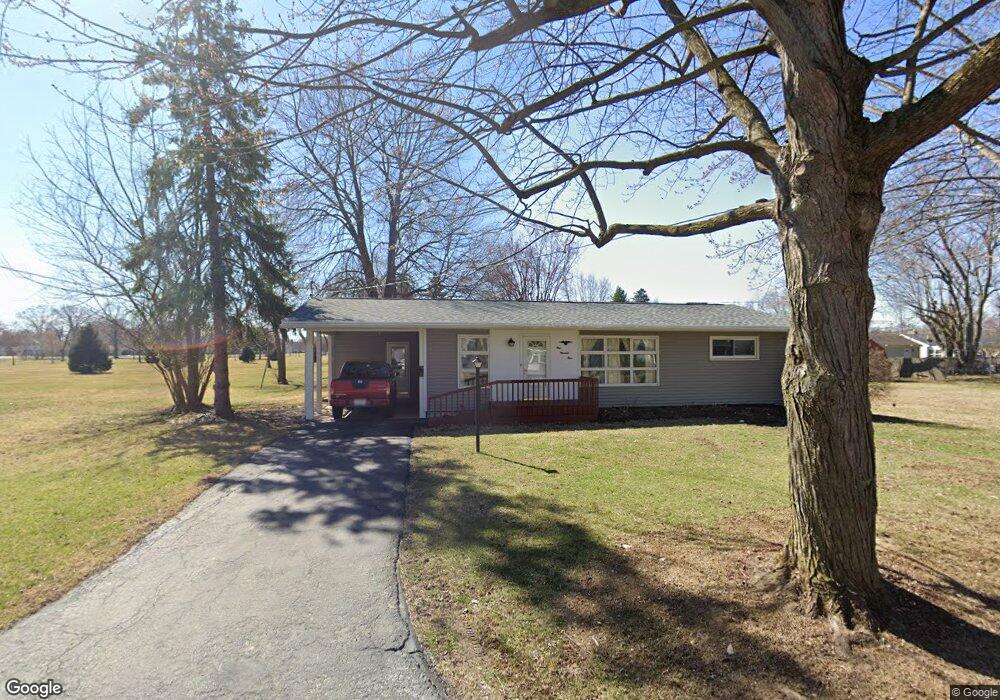
909 3rd St Findlay, OH 45840
Estimated Value: $179,592 - $208,000
2
Beds
2
Baths
1,781
Sq Ft
$107/Sq Ft
Est. Value
About This Home
This home is located at 909 3rd St, Findlay, OH 45840 and is currently estimated at $190,148, approximately $106 per square foot. 909 3rd St is a home located in Hancock County with nearby schools including Whittier Elementary School, Wilson Vance Elementary School, and Donnell Middle School.
Ownership History
Date
Name
Owned For
Owner Type
Purchase Details
Closed on
Nov 25, 2013
Sold by
Fannie Mae
Bought by
Slaughterbeck Cheryl
Current Estimated Value
Purchase Details
Closed on
Mar 9, 2013
Sold by
Ehrnschwender Gerald J
Bought by
Federal National Mortgage Association
Purchase Details
Closed on
Feb 17, 1984
Bought by
Ehrnschwender Gerald J and Ehrnschwender Betty
Create a Home Valuation Report for This Property
The Home Valuation Report is an in-depth analysis detailing your home's value as well as a comparison with similar homes in the area
Home Values in the Area
Average Home Value in this Area
Purchase History
| Date | Buyer | Sale Price | Title Company |
|---|---|---|---|
| Slaughterbeck Cheryl | -- | Omega Title Agency Llc | |
| Federal National Mortgage Association | $97,133 | None Available | |
| Ehrnschwender Gerald J | -- | -- |
Source: Public Records
Tax History
| Year | Tax Paid | Tax Assessment Tax Assessment Total Assessment is a certain percentage of the fair market value that is determined by local assessors to be the total taxable value of land and additions on the property. | Land | Improvement |
|---|---|---|---|---|
| 2024 | $1,516 | $42,690 | $5,270 | $37,420 |
| 2023 | $1,519 | $42,690 | $5,270 | $37,420 |
| 2022 | $1,514 | $42,690 | $5,270 | $37,420 |
| 2021 | $1,248 | $30,660 | $6,220 | $24,440 |
| 2020 | $1,248 | $30,660 | $6,220 | $24,440 |
| 2019 | $1,223 | $30,660 | $6,220 | $24,440 |
| 2018 | $1,314 | $30,180 | $6,220 | $23,960 |
| 2017 | $1,312 | $30,180 | $6,220 | $23,960 |
| 2016 | $1,301 | $30,180 | $6,220 | $23,960 |
| 2015 | $1,510 | $34,540 | $7,260 | $27,280 |
| 2014 | $1,510 | $34,540 | $7,260 | $27,280 |
| 2012 | $1,115 | $34,000 | $7,260 | $26,740 |
Source: Public Records
Map
Nearby Homes
- 1100 Stall Dr
- 731 5th St
- 1638 Westview Dr
- 1037 Fishlock Ave
- 1105 1st St
- 15591 Canadian Way
- 15586 Canadian Way
- 15615 Canadian Way
- 423 1st St
- 0 Blanchard Ave
- 313 2nd St
- 206 Greenlawn Ave
- 400 E Pearl St
- 216 1st St
- 123 Glendale Ave
- 829 Maple Ave
- 623 E Sandusky St
- 1001 Decker Ave
- 1421 Autumn Dr
- 309 Huron Rd
Your Personal Tour Guide
Ask me questions while you tour the home.