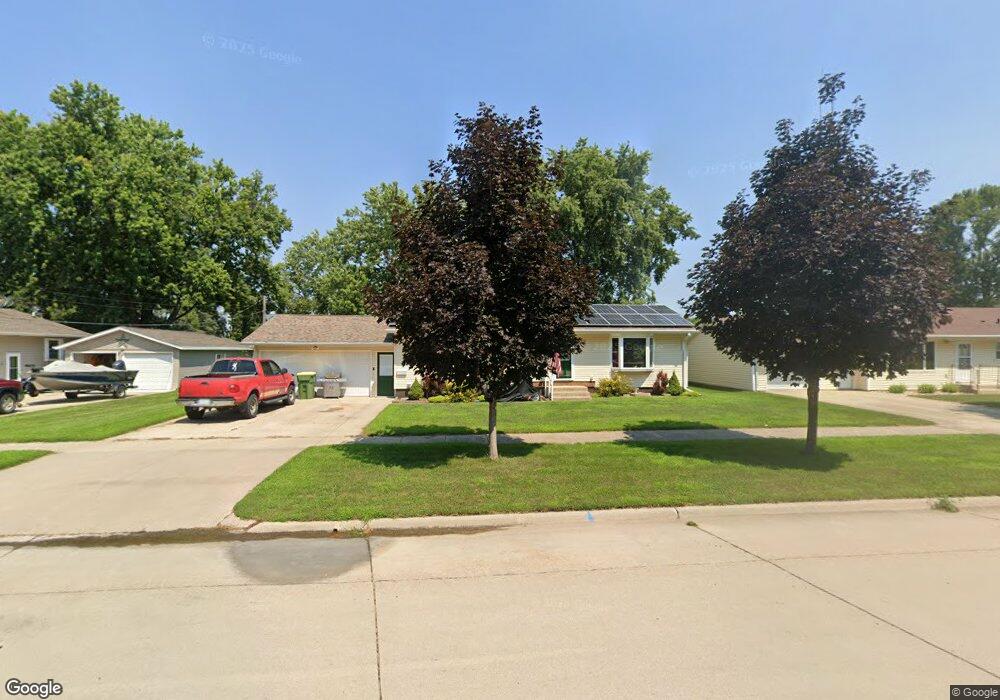
909 3rd St SE Pipestone, MN 56164
Estimated Value: $124,000 - $188,000
Studio
--
Bath
--
Sq Ft
11,848
Sq Ft Lot
About This Home
This home is located at 909 3rd St SE, Pipestone, MN 56164 and is currently estimated at $160,624. 909 3rd St SE is a home located in Pipestone County with nearby schools including Brown Elementary School, Pipestone Elementary School, and Pipestone Head Start.
Ownership History
Date
Name
Owned For
Owner Type
Purchase Details
Closed on
Aug 26, 2019
Sold by
Wienands Susan E
Bought by
Thompson Douglas A and Thompson Kathy
Current Estimated Value
Home Financials for this Owner
Home Financials are based on the most recent Mortgage that was taken out on this home.
Original Mortgage
$105,050
Outstanding Balance
$92,204
Interest Rate
3.7%
Mortgage Type
New Conventional
Estimated Equity
$68,420
Purchase Details
Closed on
Jul 18, 2018
Sold by
Kuhlman Robert N and Kuhlman Dolores D
Bought by
Wienands Susan E
Purchase Details
Closed on
Jul 22, 2005
Sold by
Roscoe Patricia A and Stoeber Lance D
Bought by
Weatherford Robert E and Weatherford Lila M
Home Financials for this Owner
Home Financials are based on the most recent Mortgage that was taken out on this home.
Original Mortgage
$14,446
Interest Rate
5.66%
Create a Home Valuation Report for This Property
The Home Valuation Report is an in-depth analysis detailing your home's value as well as a comparison with similar homes in the area
Home Values in the Area
Average Home Value in this Area
Purchase History
| Date | Buyer | Sale Price | Title Company |
|---|---|---|---|
| Thompson Douglas A | $104,000 | None Available | |
| Wienands Susan E | -- | None Available | |
| Weatherford Robert E | -- | -- |
Source: Public Records
Mortgage History
| Date | Status | Borrower | Loan Amount |
|---|---|---|---|
| Open | Thompson Douglas A | $105,050 | |
| Previous Owner | Weatherford Robert E | $14,446 | |
| Previous Owner | Weatherford Robert E | $57,784 |
Source: Public Records
Tax History
| Year | Tax Paid | Tax Assessment Tax Assessment Total Assessment is a certain percentage of the fair market value that is determined by local assessors to be the total taxable value of land and additions on the property. | Land | Improvement |
|---|---|---|---|---|
| 2025 | $1,556 | $150,200 | $12,900 | $137,300 |
| 2024 | $1,556 | $140,800 | $12,900 | $127,900 |
| 2023 | $1,372 | $132,100 | $12,900 | $119,200 |
| 2022 | $1,166 | $109,700 | $9,200 | $100,500 |
| 2021 | $1,202 | $94,100 | $9,200 | $84,900 |
| 2020 | $842 | $95,100 | $9,200 | $85,900 |
| 2019 | $1,102 | $73,500 | $7,300 | $66,200 |
| 2018 | $984 | $63,800 | $6,100 | $57,700 |
| 2017 | $988 | $58,700 | $6,100 | $52,600 |
| 2016 | $908 | $0 | $0 | $0 |
| 2015 | $1,004 | $57,800 | $6,000 | $51,800 |
| 2014 | $1,004 | $58,100 | $6,000 | $52,100 |
Source: Public Records
Map
Nearby Homes
- 201 10th Ave SE
- 702 4th St SE
- 321 5th Ave SE
- 109 5th Ave SE
- 607 4th Ave SE
- 801 6th Ave SE
- 804 6th Ave SE
- 807 7th Ave SE
- 612 7th St NE Unit 6
- 102 3rd St SE
- 804 9th St NE
- 219 3rd Ave SW
- 320 2nd St SW
- 320 2nd St NW
- 919 3rd Ave SW
- 831 4th Ave SW
- 910 3rd Ave SW
- 604 7th Ave SW
- 106 8th Ave SW
- 106 8th Ave NW
Your Personal Tour Guide
Ask me questions while you tour the home.