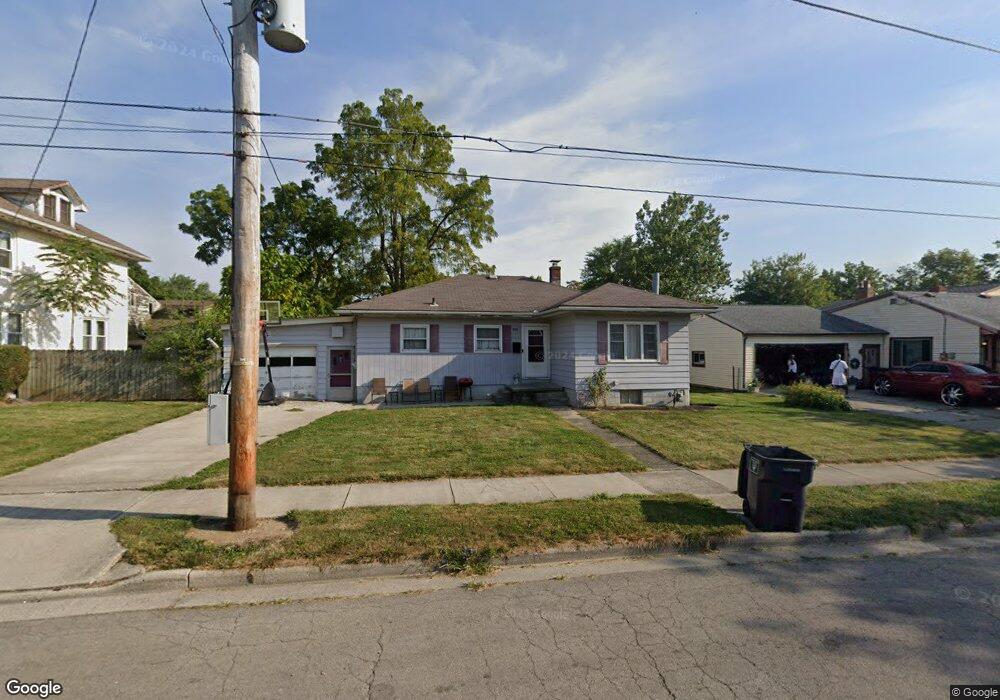
909 Catalpa Ave Lima, OH 45804
Southside Lima NeighborhoodEstimated Value: $59,716 - $91,000
2
Beds
1
Bath
1,271
Sq Ft
$57/Sq Ft
Est. Value
About This Home
This home is located at 909 Catalpa Ave, Lima, OH 45804 and is currently estimated at $72,679, approximately $57 per square foot. 909 Catalpa Ave is a home located in Allen County with nearby schools including Unity Elementary School, Lima North Middle School, and Lima West Middle School.
Ownership History
Date
Name
Owned For
Owner Type
Purchase Details
Closed on
Feb 24, 2010
Sold by
Fry Neal and Link Jim
Bought by
Haithcox Dwayne R
Current Estimated Value
Purchase Details
Closed on
Oct 26, 1999
Sold by
Davidson Gary
Bought by
Fry Neal and Roberson Michele
Home Financials for this Owner
Home Financials are based on the most recent Mortgage that was taken out on this home.
Original Mortgage
$38,450
Interest Rate
7.91%
Mortgage Type
New Conventional
Purchase Details
Closed on
Mar 26, 1999
Sold by
Parrish Anthony
Bought by
Davidson Gary and Davidson Judy
Home Financials for this Owner
Home Financials are based on the most recent Mortgage that was taken out on this home.
Original Mortgage
$31,800
Interest Rate
6.85%
Mortgage Type
New Conventional
Purchase Details
Closed on
Nov 22, 1989
Bought by
Parrish Anthony E
Create a Home Valuation Report for This Property
The Home Valuation Report is an in-depth analysis detailing your home's value as well as a comparison with similar homes in the area
Home Values in the Area
Average Home Value in this Area
Purchase History
| Date | Buyer | Sale Price | Title Company |
|---|---|---|---|
| Haithcox Dwayne R | $6,000 | None Available | |
| Fry Neal | $36,000 | -- | |
| Davidson Gary | $39,000 | -- | |
| Parrish Anthony E | -- | -- |
Source: Public Records
Mortgage History
| Date | Status | Borrower | Loan Amount |
|---|---|---|---|
| Previous Owner | Fry Neal | $38,450 | |
| Previous Owner | Davidson Gary | $31,800 |
Source: Public Records
Tax History Compared to Growth
Tax History
| Year | Tax Paid | Tax Assessment Tax Assessment Total Assessment is a certain percentage of the fair market value that is determined by local assessors to be the total taxable value of land and additions on the property. | Land | Improvement |
|---|---|---|---|---|
| 2024 | $509 | $12,290 | $1,750 | $10,540 |
| 2023 | $553 | $11,730 | $1,680 | $10,050 |
| 2022 | $556 | $11,730 | $1,680 | $10,050 |
| 2021 | $569 | $11,730 | $1,680 | $10,050 |
| 2020 | $628 | $11,730 | $1,650 | $10,080 |
| 2019 | $628 | $11,730 | $1,650 | $10,080 |
| 2018 | $623 | $11,730 | $1,650 | $10,080 |
| 2017 | $625 | $11,730 | $1,650 | $10,080 |
| 2016 | $639 | $11,730 | $1,650 | $10,080 |
| 2015 | $650 | $11,730 | $1,650 | $10,080 |
| 2014 | $650 | $12,010 | $1,720 | $10,290 |
| 2013 | $664 | $12,010 | $1,720 | $10,290 |
Source: Public Records
Map
Nearby Homes
- 1008 Fairview Ave
- 861 E 4th St
- 865 E 4th St
- 1093 S Sugar St
- 639 E 4th St
- 640 E 4th St
- 516 Catalpa Ave
- 839 Saint Johns Ave
- 600 Dingledine Ave
- 306 E Vine St
- 1147 S Union St
- 1900 Garland Ave
- 1189 S Main St
- 706 E Kibby St
- 520 Orena Ave
- 380 S Pine St
- 00 Bellefontaine Ave
- 524 S Collins Ave
- 620 E Elm St Unit 1/2
- 0 E Hanthorn Rd