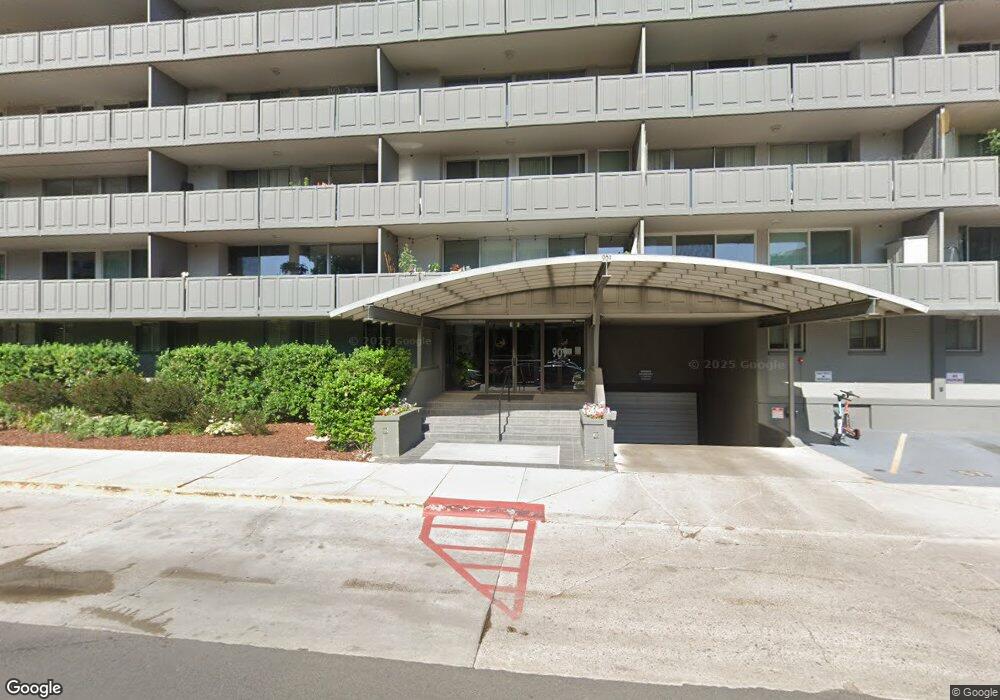
Barrington Condos 909 Logan St Unit 10H Denver, CO 80203
Capitol Hill NeighborhoodEstimated Value: $265,612 - $296,000
1
Bed
1
Bath
555
Sq Ft
$499/Sq Ft
Est. Value
About This Home
This home is located at 909 Logan St Unit 10H, Denver, CO 80203 and is currently estimated at $276,903, approximately $498 per square foot. 909 Logan St Unit 10H is a home located in Denver County with nearby schools including Dora Moore ECE-8 School, Morey Middle School, and East High School.
Ownership History
Date
Name
Owned For
Owner Type
Purchase Details
Closed on
Dec 29, 2017
Sold by
Gendel Johanna M
Bought by
Neary Brian and Neary Lisa
Current Estimated Value
Purchase Details
Closed on
Dec 28, 2015
Sold by
Cegler Tyler
Bought by
Gendel Johanna M
Home Financials for this Owner
Home Financials are based on the most recent Mortgage that was taken out on this home.
Original Mortgage
$194,750
Interest Rate
3.94%
Mortgage Type
New Conventional
Purchase Details
Closed on
Dec 4, 2012
Sold by
Mintz Jessica L
Bought by
Cegler Tyler
Home Financials for this Owner
Home Financials are based on the most recent Mortgage that was taken out on this home.
Original Mortgage
$136,972
Interest Rate
3.75%
Mortgage Type
FHA
Purchase Details
Closed on
Sep 25, 2002
Sold by
Star Trading Llc
Bought by
Mintz Jessica L
Home Financials for this Owner
Home Financials are based on the most recent Mortgage that was taken out on this home.
Original Mortgage
$122,400
Interest Rate
5.37%
Create a Home Valuation Report for This Property
The Home Valuation Report is an in-depth analysis detailing your home's value as well as a comparison with similar homes in the area
Home Values in the Area
Average Home Value in this Area
Purchase History
| Date | Buyer | Sale Price | Title Company |
|---|---|---|---|
| Neary Brian | $248,000 | Title Assure Inc | |
| Gendel Johanna M | $205,000 | First American | |
| Cegler Tyler | $139,500 | Guardian Title | |
| Mintz Jessica L | $153,000 | North American Title |
Source: Public Records
Mortgage History
| Date | Status | Borrower | Loan Amount |
|---|---|---|---|
| Previous Owner | Gendel Johanna M | $194,750 | |
| Previous Owner | Cegler Tyler | $136,972 | |
| Previous Owner | Mintz Jessica L | $122,400 | |
| Closed | Mintz Jessica L | $22,950 |
Source: Public Records
Tax History Compared to Growth
Tax History
| Year | Tax Paid | Tax Assessment Tax Assessment Total Assessment is a certain percentage of the fair market value that is determined by local assessors to be the total taxable value of land and additions on the property. | Land | Improvement |
|---|---|---|---|---|
| 2024 | $1,330 | $16,790 | $680 | $16,110 |
| 2023 | $1,301 | $16,790 | $680 | $16,110 |
| 2022 | $1,514 | $19,040 | $710 | $18,330 |
| 2021 | $1,461 | $19,580 | $730 | $18,850 |
| 2020 | $1,352 | $18,220 | $680 | $17,540 |
| 2019 | $1,314 | $18,220 | $680 | $17,540 |
| 2018 | $1,266 | $16,360 | $640 | $15,720 |
| 2017 | $1,262 | $16,360 | $640 | $15,720 |
| 2016 | $1,045 | $12,820 | $661 | $12,159 |
| 2015 | $1,002 | $12,820 | $661 | $12,159 |
| 2014 | $795 | $9,570 | $478 | $9,092 |
Source: Public Records
About Barrington Condos
Map
Nearby Homes
- 909 N Logan St Unit 3A
- 909 N Logan St Unit 11D
- 909 N Logan St Unit 4A
- 909 N Logan St Unit 1B
- 909 N Logan St Unit 6D
- 888 N Logan St Unit 4A
- 963 N Logan St Unit 11
- 855 N Pennsylvania St Unit 306
- 1000 Logan St
- 960 N Pennsylvania St Unit 16
- 801 N Pennsylvania St Unit 404
- 830 N Sherman St Unit 306
- 830 N Sherman St Unit 105
- 830 N Sherman St Unit 208
- 830 N Sherman St Unit 106
- 555 E 10th Ave Unit 114
- 555 E 10th Ave Unit 10
- 555 E 10th Ave Unit 15
- 555 E 10th Ave Unit 3
- 135 E 8th Ave
- 909 Logan St
- 909 Logan St
- 909 Logan St
- 909 Logan St Unit 11K
- 909 Logan St Unit 11J
- 909 Logan St
- 909 Logan St Unit 11H
- 909 Logan St Unit 11G
- 909 Logan St Unit 11F
- 909 Logan St Unit 11E
- 909 Logan St Unit 11D
- 909 Logan St
- 909 Logan St Unit 11B
- 909 Logan St Unit 11A
- 909 Logan St Unit 10K
- 909 Logan St Unit 10J
- 909 Logan St Unit 10I
- 909 Logan St Unit 10G
- 909 Logan St Unit 10F
- 909 Logan St Unit 10E