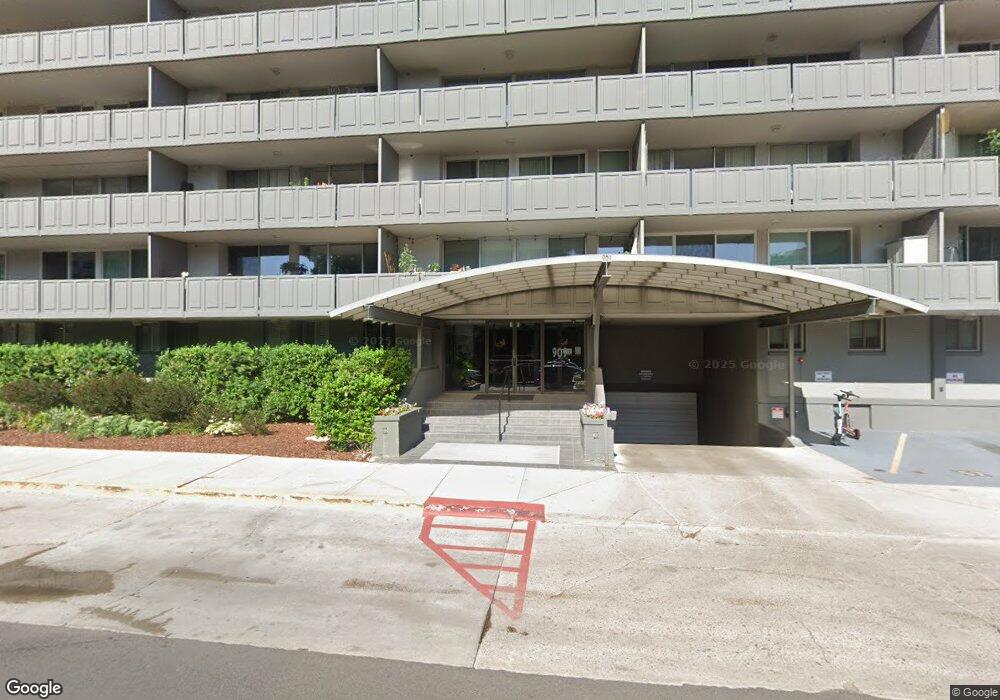
Barrington Condos 909 Logan St Unit 11H Denver, CO 80203
Capitol Hill NeighborhoodEstimated Value: $261,329 - $297,000
1
Bed
1
Bath
555
Sq Ft
$499/Sq Ft
Est. Value
About This Home
This home is located at 909 Logan St Unit 11H, Denver, CO 80203 and is currently estimated at $276,832, approximately $498 per square foot. 909 Logan St Unit 11H is a home located in Denver County with nearby schools including Dora Moore ECE-8 School, Morey Middle School, and East High School.
Ownership History
Date
Name
Owned For
Owner Type
Purchase Details
Closed on
Feb 24, 2015
Sold by
Hoffman Ryan
Bought by
Hoffman Ryan and Hoffman Amanda
Current Estimated Value
Home Financials for this Owner
Home Financials are based on the most recent Mortgage that was taken out on this home.
Original Mortgage
$125,000
Outstanding Balance
$70,771
Interest Rate
3.68%
Mortgage Type
New Conventional
Estimated Equity
$206,061
Purchase Details
Closed on
May 20, 2005
Sold by
Nuanes Nick and Nuanes Lisa
Bought by
Hoffman Ryan
Home Financials for this Owner
Home Financials are based on the most recent Mortgage that was taken out on this home.
Original Mortgage
$120,000
Interest Rate
5.87%
Mortgage Type
Fannie Mae Freddie Mac
Purchase Details
Closed on
Oct 16, 2002
Sold by
Start Trading Llc
Bought by
Nuanes Nick and Nuanes Lisa
Home Financials for this Owner
Home Financials are based on the most recent Mortgage that was taken out on this home.
Original Mortgage
$159,277
Interest Rate
6.01%
Mortgage Type
FHA
Create a Home Valuation Report for This Property
The Home Valuation Report is an in-depth analysis detailing your home's value as well as a comparison with similar homes in the area
Home Values in the Area
Average Home Value in this Area
Purchase History
| Date | Buyer | Sale Price | Title Company |
|---|---|---|---|
| Hoffman Ryan | -- | None Available | |
| Hoffman Ryan | $150,000 | Land Title Guarantee Company | |
| Nuanes Nick | $163,950 | North American Title |
Source: Public Records
Mortgage History
| Date | Status | Borrower | Loan Amount |
|---|---|---|---|
| Open | Hoffman Ryan | $125,000 | |
| Closed | Hoffman Ryan | $120,000 | |
| Previous Owner | Nuanes Nick | $159,277 | |
| Closed | Hoffman Ryan | $30,000 |
Source: Public Records
Tax History Compared to Growth
Tax History
| Year | Tax Paid | Tax Assessment Tax Assessment Total Assessment is a certain percentage of the fair market value that is determined by local assessors to be the total taxable value of land and additions on the property. | Land | Improvement |
|---|---|---|---|---|
| 2024 | $1,365 | $17,240 | $680 | $16,560 |
| 2023 | $1,336 | $17,240 | $680 | $16,560 |
| 2022 | $1,541 | $19,380 | $710 | $18,670 |
| 2021 | $1,541 | $19,930 | $730 | $19,200 |
| 2020 | $1,406 | $18,950 | $680 | $18,270 |
| 2019 | $1,367 | $18,950 | $680 | $18,270 |
| 2018 | $1,286 | $16,620 | $640 | $15,980 |
| 2017 | $1,282 | $16,620 | $640 | $15,980 |
| 2016 | $1,127 | $13,820 | $661 | $13,159 |
| 2015 | $1,080 | $13,820 | $661 | $13,159 |
| 2014 | $960 | $11,560 | $478 | $11,082 |
Source: Public Records
About Barrington Condos
Map
Nearby Homes
- 909 N Logan St Unit 3A
- 909 N Logan St Unit 11D
- 909 N Logan St Unit 4A
- 909 N Logan St Unit 1B
- 909 N Logan St Unit 6D
- 888 N Logan St Unit 4A
- 963 N Logan St Unit 11
- 855 N Pennsylvania St Unit 306
- 1000 Logan St
- 960 N Pennsylvania St Unit 16
- 801 N Pennsylvania St Unit 404
- 830 N Sherman St Unit 306
- 830 N Sherman St Unit 105
- 830 N Sherman St Unit 208
- 830 N Sherman St Unit 106
- 555 E 10th Ave Unit 114
- 555 E 10th Ave Unit 10
- 555 E 10th Ave Unit 15
- 555 E 10th Ave Unit 3
- 135 E 8th Ave
- 909 Logan St
- 909 Logan St
- 909 Logan St
- 909 Logan St Unit 11K
- 909 Logan St Unit 11J
- 909 Logan St
- 909 Logan St Unit 11G
- 909 Logan St Unit 11F
- 909 Logan St Unit 11E
- 909 Logan St Unit 11D
- 909 Logan St
- 909 Logan St Unit 11B
- 909 Logan St Unit 11A
- 909 Logan St Unit 10K
- 909 Logan St Unit 10J
- 909 Logan St Unit 10I
- 909 Logan St Unit 10H
- 909 Logan St Unit 10G
- 909 Logan St Unit 10F
- 909 Logan St Unit 10E