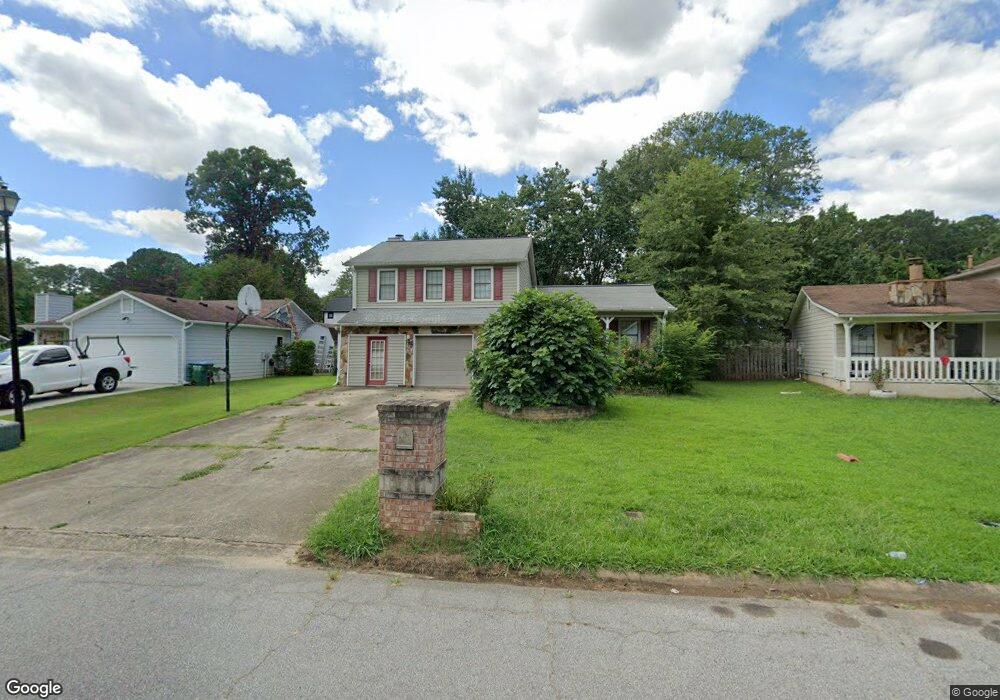
909 Wytower Trail Norcross, GA 30093
Estimated Value: $280,000 - $338,000
3
Beds
2
Baths
1,216
Sq Ft
$259/Sq Ft
Est. Value
About This Home
This home is located at 909 Wytower Trail, Norcross, GA 30093 and is currently estimated at $314,825, approximately $258 per square foot. 909 Wytower Trail is a home located in Gwinnett County with nearby schools including Lilburn Elementary School, Lilburn Middle School, and Meadowcreek High School.
Ownership History
Date
Name
Owned For
Owner Type
Purchase Details
Closed on
Dec 8, 2010
Sold by
Federal Home Loan Mortgage Corporation
Bought by
Liang Zhulin and Liang-Wen Xiaohua
Current Estimated Value
Purchase Details
Closed on
Aug 3, 2010
Sold by
Wells Fargo Bk Na
Bought by
Federal Home Loan Mortgage Corporation
Purchase Details
Closed on
May 17, 2005
Sold by
Cortez Jose V
Bought by
Ramirez Oscar J
Home Financials for this Owner
Home Financials are based on the most recent Mortgage that was taken out on this home.
Original Mortgage
$149,000
Interest Rate
5.69%
Mortgage Type
New Conventional
Purchase Details
Closed on
Feb 25, 2002
Sold by
Cobia Edward R
Bought by
Cortez Jose V
Home Financials for this Owner
Home Financials are based on the most recent Mortgage that was taken out on this home.
Original Mortgage
$123,100
Interest Rate
6.95%
Mortgage Type
New Conventional
Create a Home Valuation Report for This Property
The Home Valuation Report is an in-depth analysis detailing your home's value as well as a comparison with similar homes in the area
Home Values in the Area
Average Home Value in this Area
Purchase History
| Date | Buyer | Sale Price | Title Company |
|---|---|---|---|
| Liang Zhulin | $55,168 | -- | |
| Federal Home Loan Mortgage Corporation | -- | -- | |
| Wells Fargo Bk Na | $63,000 | -- | |
| Ramirez Oscar J | $149,000 | -- | |
| Cortez Jose V | $127,000 | -- |
Source: Public Records
Mortgage History
| Date | Status | Borrower | Loan Amount |
|---|---|---|---|
| Previous Owner | Ramirez Oscar J | $149,000 | |
| Previous Owner | Cortez Jose V | $123,100 |
Source: Public Records
Tax History Compared to Growth
Tax History
| Year | Tax Paid | Tax Assessment Tax Assessment Total Assessment is a certain percentage of the fair market value that is determined by local assessors to be the total taxable value of land and additions on the property. | Land | Improvement |
|---|---|---|---|---|
| 2025 | $4,412 | $115,280 | $21,120 | $94,160 |
| 2024 | $4,240 | $109,160 | $21,120 | $88,040 |
| 2023 | $4,240 | $104,720 | $24,800 | $79,920 |
| 2022 | $3,536 | $90,360 | $22,400 | $67,960 |
| 2021 | $2,738 | $67,040 | $16,000 | $51,040 |
| 2020 | $2,752 | $67,040 | $16,000 | $51,040 |
| 2019 | $2,342 | $58,200 | $13,600 | $44,600 |
| 2018 | $2,340 | $58,200 | $13,600 | $44,600 |
| 2016 | $1,779 | $41,680 | $10,400 | $31,280 |
| 2015 | $1,588 | $35,800 | $8,000 | $27,800 |
| 2014 | $1,596 | $35,800 | $8,000 | $27,800 |
Source: Public Records
Map
Nearby Homes
- 5444 Wylstream
- 950 Walnut Creek Dr NW Unit 2
- 5681 Williams Rd
- 0 Harbins Rd NW Unit 7598091
- 5622 Williamsburg Dr
- 5738 Brooklyn Ln
- 658 Rockbridge Rd NW
- 570 Candlewick Ln NW
- 5331 Sherwin Dr
- 5323 Sherwin Dr
- 723 Inland Way NW
- 1066 Worcester Place NW Unit 4
- 5425 Village Green Square Unit 3
- 5554 Clover Rise Ln Unit 2
- 516 Jordan Dr NW
- 640 Belgrave Ln
- 5271 Williams Rd Unit A-1
- 5775 Dekalb Ln
- 1013 Sandune Dr
- 461 Little John Dr NW
- 919 Wytower Trail Unit 3
- 899 Wytower Trail
- 5564 Wylmoor
- 929 Wytower Trail
- 5574 Wylmoor
- 5554 Wylmoor
- 889 Wytower Trail Unit 18
- 889 Wytower Trail
- 908 Wytower Trail Unit 3
- 888 Wytower Trail
- 5584 Wylmoor Unit 3
- 5544 Wylmoor Unit 3
- 918 Wytower Trail
- 879 Wytower Trail
- 5534 Wylmoor
- 939 Wytower Trail
- 928 Wytower Trail Unit 3
- 868 Wytower Trail Unit 2
- 5594 Wylmoor Unit 3
- 5524 Wylmoor