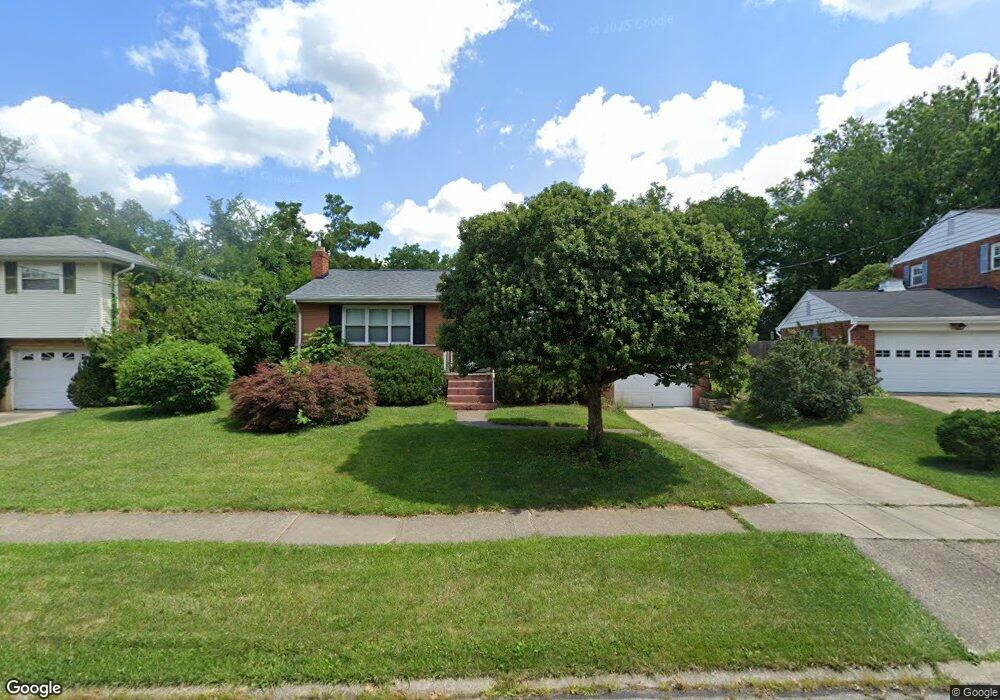
9094 Cherry Blossom Ln Cincinnati, OH 45231
Finneytown NeighborhoodEstimated Value: $266,228 - $277,000
3
Beds
3
Baths
1,563
Sq Ft
$175/Sq Ft
Est. Value
About This Home
This home is located at 9094 Cherry Blossom Ln, Cincinnati, OH 45231 and is currently estimated at $273,307, approximately $174 per square foot. 9094 Cherry Blossom Ln is a home located in Hamilton County with nearby schools including Finneytown Elementary School, Finneytown Secondary Campus, and John Paul II Catholic School.
Ownership History
Date
Name
Owned For
Owner Type
Purchase Details
Closed on
Mar 4, 2011
Sold by
Lyall Richard and Seitz Judy
Bought by
Thomas Sharon
Current Estimated Value
Home Financials for this Owner
Home Financials are based on the most recent Mortgage that was taken out on this home.
Original Mortgage
$65,000
Outstanding Balance
$3,011
Interest Rate
4.85%
Mortgage Type
New Conventional
Estimated Equity
$270,296
Purchase Details
Closed on
Apr 29, 1998
Sold by
Mcclary Andrew P and Mcclary Elizabeth M
Bought by
Lyall Richard and Lyall Lisa M
Purchase Details
Closed on
Aug 7, 1995
Sold by
Santel Jerome P
Bought by
Mcclary Andrew P and Mcclary Elizabeth M
Home Financials for this Owner
Home Financials are based on the most recent Mortgage that was taken out on this home.
Original Mortgage
$83,100
Interest Rate
7.64%
Create a Home Valuation Report for This Property
The Home Valuation Report is an in-depth analysis detailing your home's value as well as a comparison with similar homes in the area
Home Values in the Area
Average Home Value in this Area
Purchase History
| Date | Buyer | Sale Price | Title Company |
|---|---|---|---|
| Thomas Sharon | $116,900 | Prominent Title | |
| Lyall Richard | $112,700 | -- | |
| Mcclary Andrew P | -- | -- |
Source: Public Records
Mortgage History
| Date | Status | Borrower | Loan Amount |
|---|---|---|---|
| Open | Thomas Sharon | $65,000 | |
| Previous Owner | Mcclary Andrew P | $83,100 |
Source: Public Records
Tax History Compared to Growth
Tax History
| Year | Tax Paid | Tax Assessment Tax Assessment Total Assessment is a certain percentage of the fair market value that is determined by local assessors to be the total taxable value of land and additions on the property. | Land | Improvement |
|---|---|---|---|---|
| 2024 | $4,620 | $67,740 | $13,059 | $54,681 |
| 2023 | $4,542 | $67,740 | $13,059 | $54,681 |
| 2022 | $4,212 | $45,560 | $12,891 | $32,669 |
| 2021 | $4,132 | $45,560 | $12,891 | $32,669 |
| 2020 | $4,199 | $45,560 | $12,891 | $32,669 |
| 2019 | $3,856 | $38,609 | $10,924 | $27,685 |
| 2018 | $3,561 | $38,609 | $10,924 | $27,685 |
| 2017 | $3,393 | $38,609 | $10,924 | $27,685 |
| 2016 | $3,476 | $38,868 | $11,277 | $27,591 |
| 2015 | $3,498 | $38,868 | $11,277 | $27,591 |
| 2014 | $3,500 | $38,868 | $11,277 | $27,591 |
| 2013 | $3,564 | $40,915 | $11,872 | $29,043 |
Source: Public Records
Map
Nearby Homes
- 831 Compton Rd
- 820 Compton Rd
- 9132 Millcliff Dr
- 9319 Winton Rd
- 9315 Winton Rd
- 729 Fleming Rd
- 9413 Stoneybrooke
- 1031 Lost Crossing
- 9197 Long Ln
- 9458 Long Ln
- 954 Hollytree Dr
- 958 Hollytree Dr
- 8932 Hollyhock Dr
- 1100 Gracewind Ct
- 8816 Falmouth Dr
- 1013 Vacationland Dr
- 613 Heatherdale Dr
- 8925 Monsanto Dr
- 1190 Sugartree Ct
- 8491 Daly Rd
- 9098 Cherry Blossom Ln
- 9084 Cherry Blossom Ln
- 9104 Cherry Blossom Ln
- 837 Redmill Dr
- 9076 Cherry Blossom Ln
- 841 Redmill Dr
- 833 Redmill Dr
- 9112 Cherry Blossom Ln
- 9093 Cherry Blossom Ln
- 845 Redmill Dr
- 9075 Cherry Blossom Ln
- 829 Redmill Dr
- 9066 Cherry Blossom Ln
- 9105 Cherry Blossom Ln
- 9118 Cherry Blossom Ln
- 9125 Millcliff Dr
- 9135 Millcliff Dr
- 9117 Millcliff Dr
- 9055 Cherry Blossom Ln
- 9058 Cherry Blossom Ln