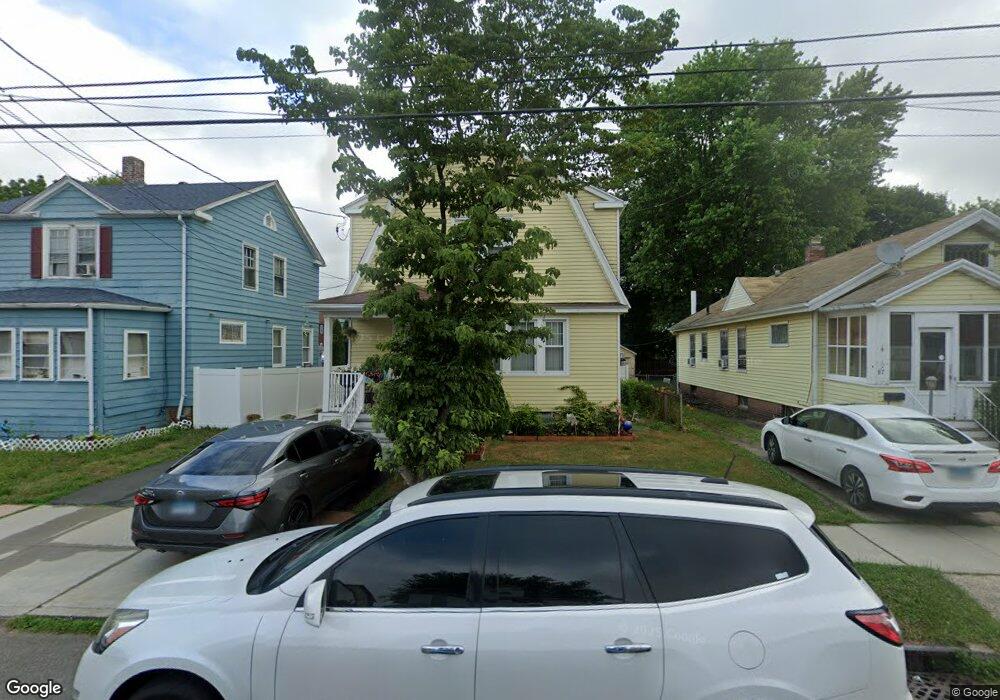
91 Concord St Hamden, CT 06514
Estimated Value: $246,000 - $301,000
3
Beds
1
Bath
1,344
Sq Ft
$211/Sq Ft
Est. Value
About This Home
This home is located at 91 Concord St, Hamden, CT 06514 and is currently estimated at $283,516, approximately $210 per square foot. 91 Concord St is a home located in New Haven County with nearby schools including Church Street School, Hamden Middle School, and Hamden High School.
Ownership History
Date
Name
Owned For
Owner Type
Purchase Details
Closed on
Nov 23, 2011
Sold by
Department Of Housing & Urban Dev
Bought by
Mckenzie Alton
Current Estimated Value
Home Financials for this Owner
Home Financials are based on the most recent Mortgage that was taken out on this home.
Original Mortgage
$137,875
Outstanding Balance
$94,127
Interest Rate
4.12%
Mortgage Type
Purchase Money Mortgage
Estimated Equity
$189,389
Purchase Details
Closed on
Mar 15, 2011
Sold by
Gmac Mtg Llc
Bought by
Department Of Housing & Urban Dev
Purchase Details
Closed on
Apr 12, 2010
Sold by
Manning Claire J
Bought by
Gmac Mortgage Llc
Purchase Details
Closed on
Nov 20, 2007
Sold by
Smith Philip F and Smith Mary K
Bought by
Manning Claire J
Create a Home Valuation Report for This Property
The Home Valuation Report is an in-depth analysis detailing your home's value as well as a comparison with similar homes in the area
Home Values in the Area
Average Home Value in this Area
Purchase History
| Date | Buyer | Sale Price | Title Company |
|---|---|---|---|
| Mckenzie Alton | $117,000 | -- | |
| Department Of Housing & Urban Dev | -- | -- | |
| Gmac Mortgage Llc | -- | -- | |
| Manning Claire J | $213,000 | -- |
Source: Public Records
Mortgage History
| Date | Status | Borrower | Loan Amount |
|---|---|---|---|
| Open | Manning Claire J | $137,875 | |
| Closed | Manning Claire J | $9,400 | |
| Previous Owner | Manning Claire J | $212,217 |
Source: Public Records
Tax History
| Year | Tax Paid | Tax Assessment Tax Assessment Total Assessment is a certain percentage of the fair market value that is determined by local assessors to be the total taxable value of land and additions on the property. | Land | Improvement |
|---|---|---|---|---|
| 2025 | $10,001 | $192,780 | $41,160 | $151,620 |
| 2024 | $6,746 | $121,310 | $26,180 | $95,130 |
| 2023 | $6,839 | $121,310 | $26,180 | $95,130 |
| 2022 | $6,730 | $121,310 | $26,180 | $95,130 |
| 2021 | $6,361 | $121,310 | $26,180 | $95,130 |
| 2020 | $5,476 | $105,350 | $29,120 | $76,230 |
| 2019 | $5,147 | $105,350 | $29,120 | $76,230 |
| 2018 | $5,053 | $105,350 | $29,120 | $76,230 |
| 2017 | $4,768 | $105,350 | $29,120 | $76,230 |
| 2016 | $4,779 | $105,350 | $29,120 | $76,230 |
| 2015 | $5,104 | $124,880 | $45,850 | $79,030 |
| 2014 | $4,986 | $124,880 | $45,850 | $79,030 |
Source: Public Records
Map
Nearby Homes
- 75 Concord St
- 1422 Dixwell Ave
- 1412 Dixwell Ave
- 50 Collins St
- 33 Bank St
- 336 Circular Ave
- 33 Newton St
- 63 Gorham Ave
- 43 Gorham Ave
- 12 Pond Rd
- 2 Village Cir Unit 2
- 77 Blue Hills Ave
- 191 Bradley Ave
- 82 Helen St
- 89 Glenbrook Ave
- 61 Reyna Rd
- 1690 Dixwell Ave Unit B3
- 26 4th St
- 290 Treadwell St Unit 1402
- 49 3rd St
Your Personal Tour Guide
Ask me questions while you tour the home.