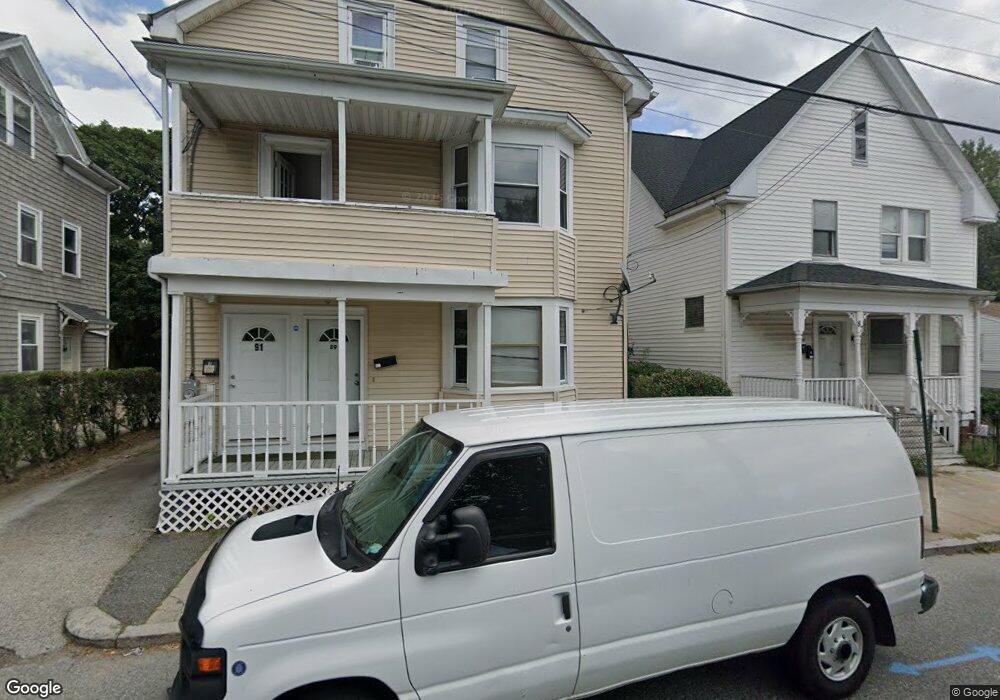
91 Ruggles St Providence, RI 02908
Smith Hill NeighborhoodEstimated Value: $408,205 - $567,000
6
Beds
3
Baths
2,151
Sq Ft
$235/Sq Ft
Est. Value
About This Home
This home is located at 91 Ruggles St, Providence, RI 02908 and is currently estimated at $505,301, approximately $234 per square foot. 91 Ruggles St is a home located in Providence County with nearby schools including Asa Messer Elementary School, Charles N. Fortes Elementary School, and Veazie Street Elementary School.
Ownership History
Date
Name
Owned For
Owner Type
Purchase Details
Closed on
Oct 4, 2021
Sold by
Roldan Francis
Bought by
F & M Invs & Re Llc
Current Estimated Value
Home Financials for this Owner
Home Financials are based on the most recent Mortgage that was taken out on this home.
Original Mortgage
$556,500
Outstanding Balance
$507,476
Interest Rate
2.8%
Mortgage Type
Stand Alone Refi Refinance Of Original Loan
Estimated Equity
-$2,175
Purchase Details
Closed on
Jun 24, 2014
Sold by
Perez Geronimo and Us Bank Na Tr
Bought by
Us Bank Na Tr
Purchase Details
Closed on
Nov 22, 2002
Sold by
Laliemthavisay P P and Laliemthavisay Chanthala
Bought by
Perez Geronimo
Home Financials for this Owner
Home Financials are based on the most recent Mortgage that was taken out on this home.
Original Mortgage
$146,343
Interest Rate
6.07%
Mortgage Type
Purchase Money Mortgage
Create a Home Valuation Report for This Property
The Home Valuation Report is an in-depth analysis detailing your home's value as well as a comparison with similar homes in the area
Home Values in the Area
Average Home Value in this Area
Purchase History
| Date | Buyer | Sale Price | Title Company |
|---|---|---|---|
| F & M Invs & Re Llc | -- | None Available | |
| Us Bank Na Tr | $93,500 | -- | |
| Perez Geronimo | $147,500 | -- |
Source: Public Records
Mortgage History
| Date | Status | Borrower | Loan Amount |
|---|---|---|---|
| Open | F & M Invs & Re Llc | $556,500 | |
| Previous Owner | Perez Geronimo | $25,000 | |
| Previous Owner | Perez Geronimo | $146,343 |
Source: Public Records
Tax History Compared to Growth
Tax History
| Year | Tax Paid | Tax Assessment Tax Assessment Total Assessment is a certain percentage of the fair market value that is determined by local assessors to be the total taxable value of land and additions on the property. | Land | Improvement |
|---|---|---|---|---|
| 2024 | $5,065 | $276,000 | $68,000 | $208,000 |
| 2023 | $5,065 | $276,000 | $68,000 | $208,000 |
| 2022 | $4,913 | $276,000 | $68,000 | $208,000 |
| 2021 | $3,915 | $159,400 | $33,500 | $125,900 |
| 2020 | $3,915 | $159,400 | $33,500 | $125,900 |
| 2019 | $3,915 | $159,400 | $33,500 | $125,900 |
| 2018 | $3,762 | $117,700 | $36,000 | $81,700 |
| 2017 | $3,762 | $117,700 | $36,000 | $81,700 |
| 2016 | $3,762 | $117,700 | $36,000 | $81,700 |
| 2015 | $3,615 | $109,200 | $47,100 | $62,100 |
| 2014 | $3,686 | $109,200 | $47,100 | $62,100 |
| 2013 | $3,686 | $109,200 | $47,100 | $62,100 |
Source: Public Records
Map
Nearby Homes
- 41 Frederick St
- 46 Osborn St
- 33 Dome St Unit A
- 42 Osborn St
- 16 Ruggles St
- 154 Camden Ave
- 38 Pembroke Ave
- 23 Richter St
- 83 Pekin St
- 84 Pembroke Ave
- 192 Oakland Ave
- 331 Douglas Ave
- 105 Garfield Ave
- 41 Higgins Ave
- 510 Chalkstone Ave
- 231 Douglas Ave Unit R05
- 13 Suffolk St
- 39 Felix St
- 380 Smith St
- 9 Convent St