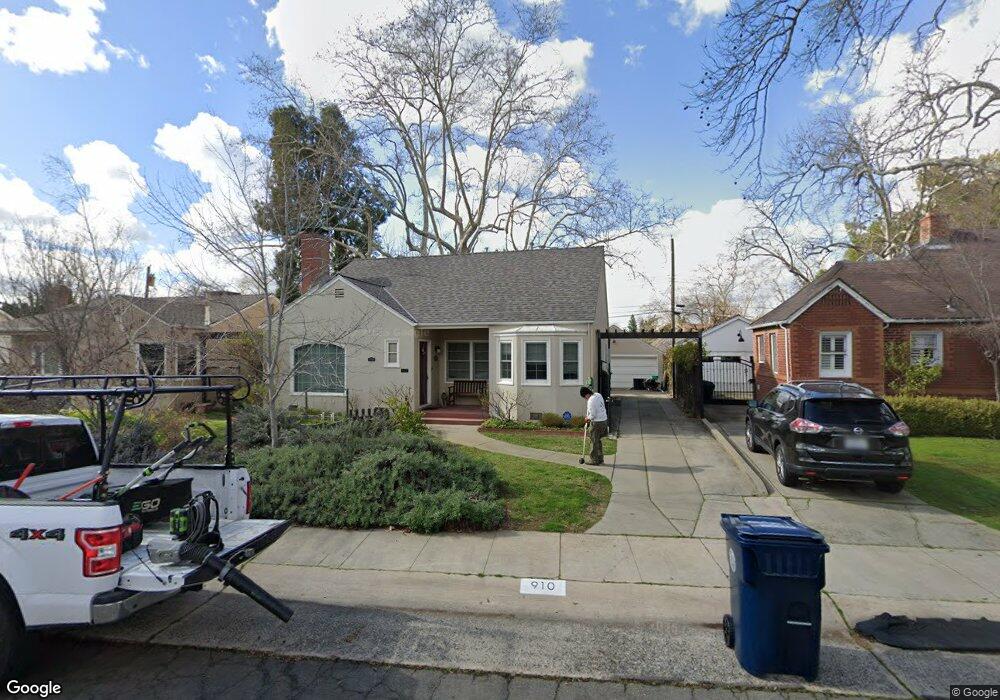
910 54th St Sacramento, CA 95819
East Sacramento NeighborhoodEstimated Value: $502,000 - $659,000
2
Beds
1
Bath
1,179
Sq Ft
$508/Sq Ft
Est. Value
About This Home
This home is located at 910 54th St, Sacramento, CA 95819 and is currently estimated at $599,076, approximately $508 per square foot. 910 54th St is a home located in Sacramento County with nearby schools including Caleb Greenwood Elementary, Miwok Middle School, and Hiram W. Johnson High School.
Ownership History
Date
Name
Owned For
Owner Type
Purchase Details
Closed on
May 7, 1999
Sold by
Hurwitt Rowe Kathrina Lynette and Hurwitt Peter G
Bought by
Pepper Susan M
Current Estimated Value
Home Financials for this Owner
Home Financials are based on the most recent Mortgage that was taken out on this home.
Original Mortgage
$139,100
Interest Rate
6.94%
Purchase Details
Closed on
May 6, 1997
Sold by
Rowe Kathrina Lynette
Bought by
Hurwitt Peter G and Rowe Kathrina Lynette
Home Financials for this Owner
Home Financials are based on the most recent Mortgage that was taken out on this home.
Original Mortgage
$10,000
Interest Rate
7.98%
Mortgage Type
Credit Line Revolving
Purchase Details
Closed on
Feb 15, 1994
Sold by
Hurwitt Peter Gene
Bought by
Rowe Kathrina Lynette
Create a Home Valuation Report for This Property
The Home Valuation Report is an in-depth analysis detailing your home's value as well as a comparison with similar homes in the area
Home Values in the Area
Average Home Value in this Area
Purchase History
| Date | Buyer | Sale Price | Title Company |
|---|---|---|---|
| Pepper Susan M | $173,000 | Chicago Title Co | |
| Hurwitt Peter G | -- | Chicago Title | |
| Rowe Kathrina Lynette | -- | Pacific Coast Title Company |
Source: Public Records
Mortgage History
| Date | Status | Borrower | Loan Amount |
|---|---|---|---|
| Previous Owner | Rowe Kathrina Lynette | $17,200 | |
| Previous Owner | Pepper Susan M | $139,100 | |
| Previous Owner | Hurwitt Peter G | $10,000 |
Source: Public Records
Tax History Compared to Growth
Tax History
| Year | Tax Paid | Tax Assessment Tax Assessment Total Assessment is a certain percentage of the fair market value that is determined by local assessors to be the total taxable value of land and additions on the property. | Land | Improvement |
|---|---|---|---|---|
| 2025 | $3,218 | $272,598 | $101,887 | $170,711 |
| 2024 | $3,218 | $267,254 | $99,890 | $167,364 |
| 2023 | $3,141 | $262,015 | $97,932 | $164,083 |
| 2022 | $3,086 | $256,878 | $96,012 | $160,866 |
| 2021 | $2,940 | $251,842 | $94,130 | $157,712 |
| 2020 | $2,962 | $249,260 | $93,165 | $156,095 |
| 2019 | $2,898 | $244,374 | $91,339 | $153,035 |
| 2018 | $2,822 | $239,584 | $89,549 | $150,035 |
| 2017 | $2,781 | $234,888 | $87,794 | $147,094 |
| 2016 | $2,727 | $230,283 | $86,073 | $144,210 |
| 2015 | $2,686 | $226,825 | $84,781 | $142,044 |
| 2014 | $2,613 | $222,383 | $83,121 | $139,262 |
Source: Public Records
Map
Nearby Homes