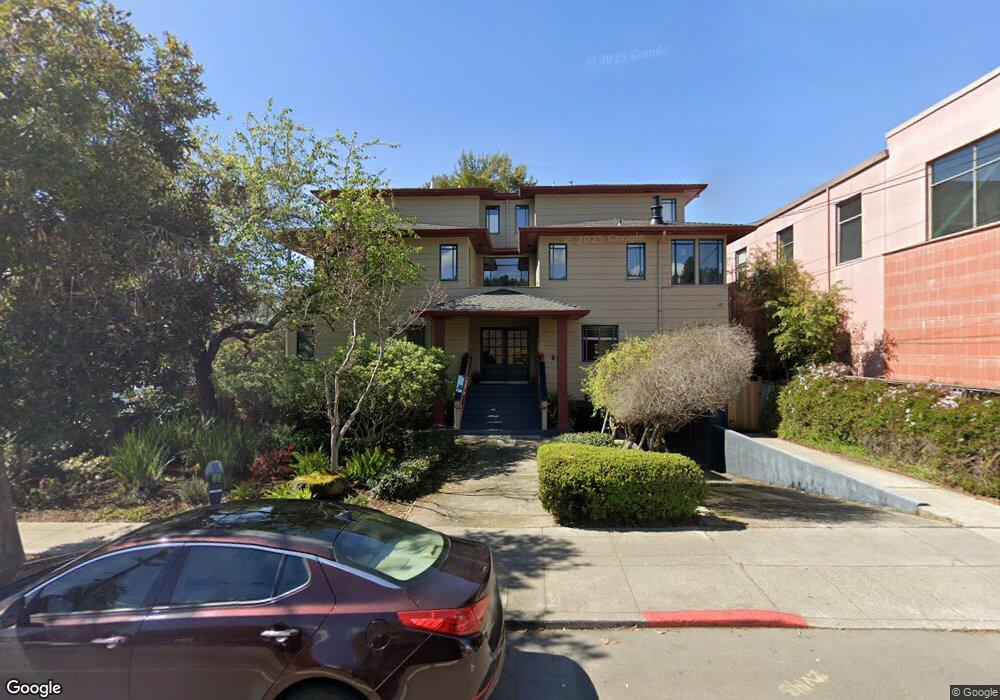
910 Colusa Ave Unit 3 Berkeley, CA 94707
Northbrae NeighborhoodEstimated Value: $668,064 - $914,000
2
Beds
2
Baths
1,077
Sq Ft
$774/Sq Ft
Est. Value
About This Home
This home is located at 910 Colusa Ave Unit 3, Berkeley, CA 94707 and is currently estimated at $834,016, approximately $774 per square foot. 910 Colusa Ave Unit 3 is a home located in Alameda County with nearby schools including Thousand Oaks Elementary School, Ruth Acty Elementary, and Berkeley Arts Magnet at Whittier School.
Ownership History
Date
Name
Owned For
Owner Type
Purchase Details
Closed on
Jul 29, 1999
Sold by
Ledger Agnes L
Bought by
Blakeley Alta and Ledger James E
Current Estimated Value
Home Financials for this Owner
Home Financials are based on the most recent Mortgage that was taken out on this home.
Original Mortgage
$137,500
Outstanding Balance
$36,263
Interest Rate
7.05%
Mortgage Type
Stand Alone First
Estimated Equity
$797,753
Purchase Details
Closed on
Jun 23, 1999
Sold by
Boyd Ronald A and Boyd Marilyn
Bought by
Deraadt Katherine L
Home Financials for this Owner
Home Financials are based on the most recent Mortgage that was taken out on this home.
Original Mortgage
$137,500
Outstanding Balance
$36,263
Interest Rate
7.05%
Mortgage Type
Stand Alone First
Estimated Equity
$797,753
Purchase Details
Closed on
May 27, 1999
Sold by
Deraadt Arie G
Bought by
Deraadt Katherine L
Home Financials for this Owner
Home Financials are based on the most recent Mortgage that was taken out on this home.
Original Mortgage
$137,500
Outstanding Balance
$36,263
Interest Rate
7.05%
Mortgage Type
Stand Alone First
Estimated Equity
$797,753
Create a Home Valuation Report for This Property
The Home Valuation Report is an in-depth analysis detailing your home's value as well as a comparison with similar homes in the area
Home Values in the Area
Average Home Value in this Area
Purchase History
| Date | Buyer | Sale Price | Title Company |
|---|---|---|---|
| Blakeley Alta | -- | -- | |
| Ledger Agnes L | -- | -- | |
| Deraadt Katherine L | $225,000 | Old Republic Title Company | |
| Deraadt Katherine L | -- | Old Republic Title Company |
Source: Public Records
Mortgage History
| Date | Status | Borrower | Loan Amount |
|---|---|---|---|
| Open | Deraadt Katherine L | $137,500 |
Source: Public Records
Tax History
| Year | Tax Paid | Tax Assessment Tax Assessment Total Assessment is a certain percentage of the fair market value that is determined by local assessors to be the total taxable value of land and additions on the property. | Land | Improvement |
|---|---|---|---|---|
| 2025 | $3,072 | $64,590 | $18,142 | $53,448 |
| 2024 | $3,072 | $63,186 | $17,786 | $52,400 |
| 2023 | $2,983 | $68,809 | $17,437 | $51,372 |
| 2022 | $2,879 | $60,460 | $17,095 | $50,365 |
| 2021 | $2,850 | $59,138 | $16,760 | $49,378 |
| 2020 | $2,585 | $65,460 | $16,588 | $48,872 |
| 2019 | $2,358 | $64,177 | $16,263 | $47,914 |
| 2018 | $2,288 | $62,918 | $15,944 | $46,974 |
| 2017 | $2,179 | $61,685 | $15,632 | $46,053 |
| 2016 | $2,018 | $60,475 | $15,325 | $45,150 |
| 2015 | $2,455 | $59,567 | $15,095 | $44,472 |
| 2014 | $1,929 | $58,400 | $14,799 | $43,601 |
Source: Public Records
Map
Nearby Homes
- 1858 San Lorenzo Ave
- 1741 Sonoma Ave
- 1983 Yosemite Rd
- 753 Peralta Ave
- 1950 Hopkins St
- 1498 Sonoma Ave
- 765 San Diego Rd
- 813 San Diego Rd
- 1626 Hopkins St
- 491 Vincente Ave
- 938 San Benito Rd
- 1036 Ramona Ave
- 758 Spruce St
- 415 Berkeley Park Blvd
- 589 San Luis Rd
- 2121 Eunice St
- 1120 Curtis St
- 1004 Cragmont Ave
- 777 Cragmont Ave
- 1325 Henry St
- 910 Colusa Ave Unit 6
- 910 Colusa Ave Unit 5
- 910 Colusa Ave Unit 4
- 910 Colusa Ave Unit 2
- 910 Colusa Ave Unit 1
- 920 Colusa Ave
- 1820 Solano Ave
- 905 Modoc St
- 911 Modoc St
- 913 Modoc St
- 924 Colusa Ave
- 919 Modoc St
- 928 Colusa Ave
- 897 Colusa Ave
- 929 Modoc St
- 932 Colusa Ave
- 931 Modoc St
- 929 Colusa Ave
- 1819 Solano Ave
- 935 Modoc St
Your Personal Tour Guide
Ask me questions while you tour the home.