Estimated Value: $1,039,537
Studio
--
Bath
4,907
Sq Ft
$212/Sq Ft
Est. Value
About This Home
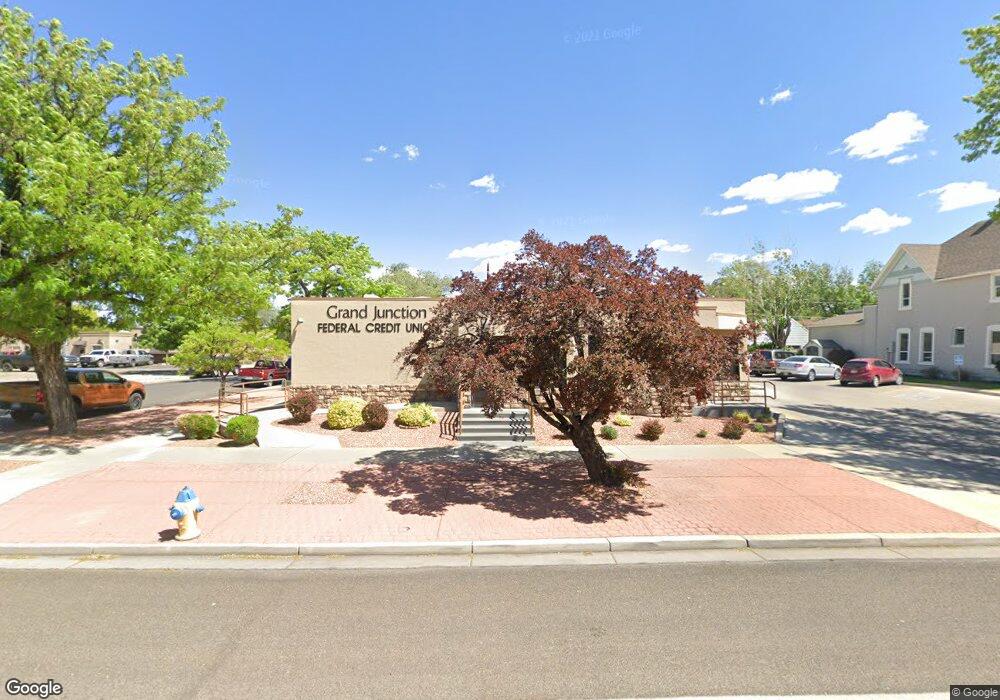
This home is located at 910 Main St, Grand Junction, CO 81501 and is currently estimated at $1,039,537, approximately $211 per square foot. 910 Main St is a home located in Mesa County with nearby schools including Chipeta Elementary School, West Middle School, and Grand Junction High School.
Ownership History
Date
Name
Owned For
Owner Type
Purchase Details
Closed on
Sep 29, 2021
Sold by
Valley Exchange Properties Iii Llc
Bought by
City Of Grand Junction
Current Estimated Value
Purchase Details
Closed on
Mar 31, 2021
Sold by
Grand Junction Federal Credit Union
Bought by
Valley Exchange Properties Iii Llc
Purchase Details
Closed on
Mar 13, 2003
Sold by
Coloramo Fcu
Bought by
Grand Junction Fcu
Purchase Details
Closed on
Nov 15, 2001
Sold by
Colorado Fcu
Bought by
Grand Junction Fcu
Create a Home Valuation Report for This Property
The Home Valuation Report is an in-depth analysis detailing your home's value as well as a comparison with similar homes in the area
Home Values in the Area
Average Home Value in this Area
Purchase History
| Date | Buyer | Sale Price | Title Company |
|---|---|---|---|
| City Of Grand Junction | $877,000 | Abstract & Title Co | |
| Valley Exchange Properties Iii Llc | $1,100,000 | Abstract & Title Co | |
| Grand Junction Fcu | -- | -- | |
| Grand Junction Fcu | $520,000 | -- |
Source: Public Records
Tax History
| Year | Tax Paid | Tax Assessment Tax Assessment Total Assessment is a certain percentage of the fair market value that is determined by local assessors to be the total taxable value of land and additions on the property. | Land | Improvement |
|---|---|---|---|---|
| 2024 | -- | $320,360 | $20,610 | $299,750 |
| 2023 | -- | $320,360 | $20,610 | $299,750 |
| 2022 | $0 | $198,530 | $24,470 | $174,060 |
| 2021 | $10,364 | $198,530 | $24,470 | $174,060 |
| 2020 | $11,674 | $169,910 | $22,430 | $147,480 |
| 2019 | $8,186 | $126,010 | $22,430 | $103,580 |
| 2018 | $5,789 | $81,820 | $15,630 | $66,190 |
| 2017 | $5,768 | $81,820 | $15,630 | $66,190 |
| 2016 | $4,779 | $76,190 | $15,770 | $60,420 |
| 2015 | $4,841 | $76,190 | $15,770 | $60,420 |
| 2014 | $4,347 | $68,950 | $17,010 | $51,940 |
Source: Public Records
Map
Nearby Homes
- 920 Main St
- 903 Main St
- 907 Rood Ave
- 907 Rood Ave Unit Rood Downstairs 2 Be
- 907 Rood Ave Unit Rood Ave Upstairs
- 919 Main St
- 940 Main St
- 923 Rood Ave
- 851 Rood Ave
- 929 Main St
- 931 Rood Ave Unit 1, 2
- 937 Rood Ave
- 946 Main St
- 943 Rood Ave
- 935 Main St
- 941 Main St
- 843 Rood Ave
- 960 Main St
- 957 Rood Ave
- 902 Rood Ave
Your Personal Tour Guide
Ask me questions while you tour the home.