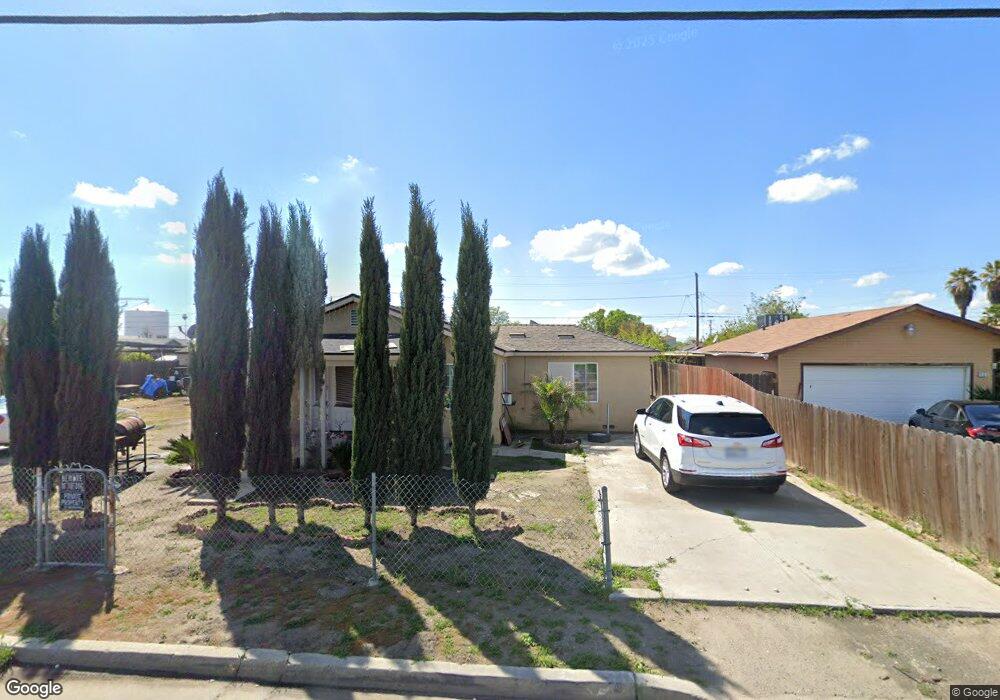
910 Pickerell Ave Corcoran, CA 93212
Estimated Value: $178,000 - $239,000
1
Bed
1
Bath
384
Sq Ft
$565/Sq Ft
Est. Value
About This Home
This home is located at 910 Pickerell Ave, Corcoran, CA 93212 and is currently estimated at $217,016, approximately $565 per square foot. 910 Pickerell Ave is a home located in Kings County with nearby schools including John C. Fremont Elementary School, Bret Harte Elementary School, and Mark Twain Elementary School.
Ownership History
Date
Name
Owned For
Owner Type
Purchase Details
Closed on
Mar 12, 2024
Sold by
Galindo Franco Abraham
Bought by
Galindo Abraham Jimenez and Galindo Jose Jesus
Current Estimated Value
Purchase Details
Closed on
Mar 6, 2024
Sold by
Galindo Franco Abraham
Bought by
Jimenez Galindo Abraham and Jimene Galindo Jose
Purchase Details
Closed on
Sep 19, 2023
Sold by
Jimenez Galindo Abraham
Bought by
Galindo Franco Abraham
Purchase Details
Closed on
Sep 1, 2023
Sold by
Jimenez Galindo Abraham
Bought by
Franco Abraham Galindo
Purchase Details
Closed on
Mar 14, 2014
Sold by
Watley Tyrone
Bought by
Jimenez Franco Abraham Galindo and Jimenez Galindo Abraham
Purchase Details
Closed on
Mar 13, 2014
Sold by
Watley Lucretia C
Bought by
Watley Tyrone
Create a Home Valuation Report for This Property
The Home Valuation Report is an in-depth analysis detailing your home's value as well as a comparison with similar homes in the area
Purchase History
| Date | Buyer | Sale Price | Title Company |
|---|---|---|---|
| Galindo Abraham Jimenez | -- | None Listed On Document | |
| Jimenez Galindo Abraham | -- | None Listed On Document | |
| Galindo Franco Abraham | -- | None Listed On Document | |
| Franco Abraham Galindo | -- | None Listed On Document | |
| Jimenez Franco Abraham Galindo | $25,000 | Stewart Title Of Ca Inc | |
| Watley Tyrone | -- | Stewart Title Of Ca Inc |
Source: Public Records
Tax History
| Year | Tax Paid | Tax Assessment Tax Assessment Total Assessment is a certain percentage of the fair market value that is determined by local assessors to be the total taxable value of land and additions on the property. | Land | Improvement |
|---|---|---|---|---|
| 2025 | $1,281 | $219,300 | $45,900 | $173,400 |
| 2023 | $1,281 | $45,883 | $23,566 | $22,317 |
| 2022 | $480 | $44,984 | $23,104 | $21,880 |
| 2021 | $470 | $44,102 | $22,651 | $21,451 |
| 2020 | $460 | $43,650 | $22,419 | $21,231 |
| 2019 | $465 | $42,794 | $21,979 | $20,815 |
| 2018 | $457 | $41,955 | $21,548 | $20,407 |
| 2017 | $447 | $41,132 | $21,125 | $20,007 |
| 2016 | $436 | $40,326 | $20,711 | $19,615 |
| 2015 | $435 | $39,720 | $20,400 | $19,320 |
| 2014 | $187 | $17,005 | $1,200 | $15,805 |
Source: Public Records
Map
Nearby Homes
- 817 Hall Ave
- 1107 Patterson Ave
- 916 Norboe Ave
- 1015 Hall Ave
- 1121 Jepsen Ave
- 628 Norboe Ave
- 1021 Stanley Ave
- 1500 Hanna Ave
- 1317 Hall Ave
- 1633 Chase Ave
- 1016 Wigdal Ave
- 1701 Chase Ave
- 1516 Jepsen Ave
- 1036 Bainum Ave
- 1040 Josephine Ave
- 726 Josephine Ave
- 1801 Hale Ave
- 1611 Letts Ave
- 1901 Patterson Ave
- 1926 Carnation Ct
- 908 Pickerell Ave
- 916 Pickerell Ave
- 605 Brokaw Ave
- 924 Pickerell Ave
- 909 Gardner Ave
- 1004 Pickerell Ave
- 604 Hanna Ave
- 919 Gardner Ave
- 915 Gardner Ave
- 905 Gardner Ave
- 917 Gardner Ave
- 600 Brokaw Ave
- 808 Pickerell Ave
- 1000 Pickerell Ave
- 925 Gardner Ave
- 901 Gardner Ave
- 804 Pickerell Ave
- 815 Gardner Ave
- 1005 Gardner Ave
- 811 Gardner Ave
Your Personal Tour Guide
Ask me questions while you tour the home.