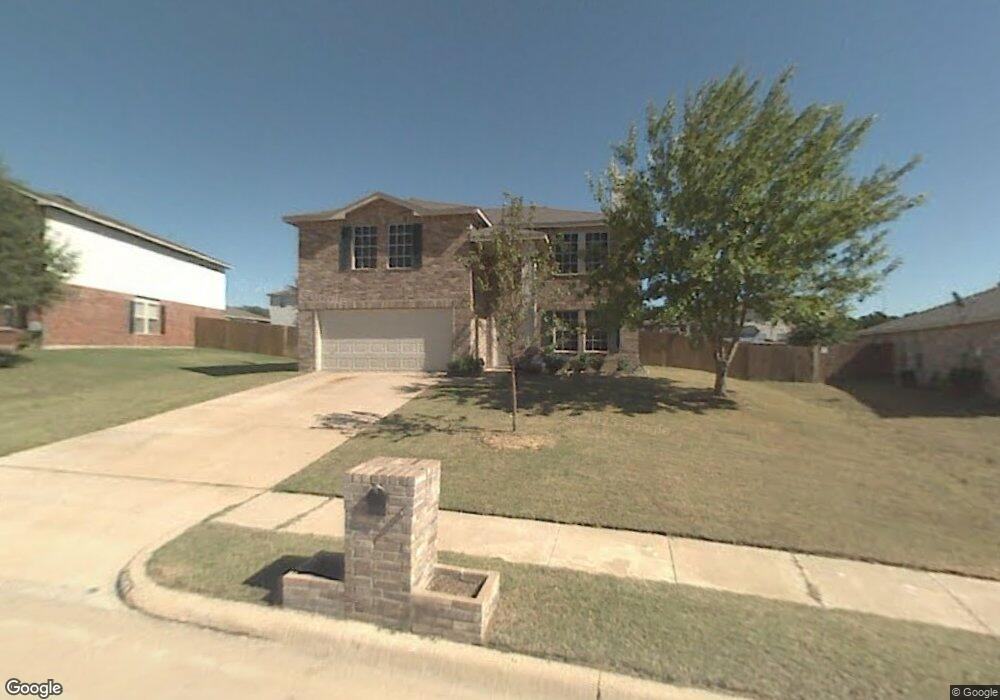
9101 Harvest Moon Trail Denton, TX 76210
South Denton NeighborhoodEstimated Value: $346,000 - $367,412
3
Beds
3
Baths
2,136
Sq Ft
$167/Sq Ft
Est. Value
About This Home
This home is located at 9101 Harvest Moon Trail, Denton, TX 76210 and is currently estimated at $357,103, approximately $167 per square foot. 9101 Harvest Moon Trail is a home located in Denton County with nearby schools including McNair Elementary School, Harpool Middle School, and Guyer High School.
Ownership History
Date
Name
Owned For
Owner Type
Purchase Details
Closed on
Jul 3, 2018
Sold by
Gregory David M and Gregory Mariellen
Bought by
Gomez Javier Oswaldo Henriquez and Marin Reina Elizabeth Benitez
Current Estimated Value
Home Financials for this Owner
Home Financials are based on the most recent Mortgage that was taken out on this home.
Original Mortgage
$198,000
Outstanding Balance
$146,736
Interest Rate
4.6%
Mortgage Type
New Conventional
Estimated Equity
$210,367
Purchase Details
Closed on
Jul 17, 2001
Sold by
Centex Homes
Bought by
Gregory David M and Gregory Mariellen
Home Financials for this Owner
Home Financials are based on the most recent Mortgage that was taken out on this home.
Original Mortgage
$97,600
Interest Rate
7.05%
Create a Home Valuation Report for This Property
The Home Valuation Report is an in-depth analysis detailing your home's value as well as a comparison with similar homes in the area
Home Values in the Area
Average Home Value in this Area
Purchase History
| Date | Buyer | Sale Price | Title Company |
|---|---|---|---|
| Gomez Javier Oswaldo Henriquez | -- | None Available | |
| Gregory David M | -- | -- |
Source: Public Records
Mortgage History
| Date | Status | Borrower | Loan Amount |
|---|---|---|---|
| Open | Gomez Javier Oswaldo Henriquez | $198,000 | |
| Previous Owner | Gregory David M | $97,600 |
Source: Public Records
Tax History Compared to Growth
Tax History
| Year | Tax Paid | Tax Assessment Tax Assessment Total Assessment is a certain percentage of the fair market value that is determined by local assessors to be the total taxable value of land and additions on the property. | Land | Improvement |
|---|---|---|---|---|
| 2025 | $6,604 | $345,786 | $80,947 | $264,839 |
| 2024 | $6,604 | $342,145 | $80,947 | $261,198 |
| 2023 | $6,873 | $359,979 | $80,947 | $279,032 |
| 2022 | $6,135 | $289,000 | $80,947 | $208,053 |
| 2021 | $5,689 | $255,924 | $58,557 | $197,367 |
| 2020 | $5,236 | $229,083 | $58,557 | $170,526 |
| 2019 | $5,416 | $227,000 | $58,557 | $168,443 |
| 2018 | $5,095 | $210,924 | $47,077 | $165,325 |
| 2017 | $4,740 | $191,749 | $47,077 | $144,672 |
| 2016 | $4,215 | $177,522 | $36,317 | $141,205 |
| 2015 | $3,465 | $162,113 | $36,317 | $125,796 |
| 2013 | -- | $138,622 | $34,000 | $104,622 |
Source: Public Records
Map
Nearby Homes
- 8813 Swan Park Dr
- 8704 Serenity Way
- 2067 Leatherwood Ln
- 1569 Stanford Ct
- 8404 Glen Falls Ln
- 7912 Hidden Path Ln
- 8204 Montecito Dr
- 7804 Hidden Path Ln
- 1217 Golden Sand Dr
- 1612 Marble Cove Ln
- 2109 Doecrest Dr
- 2912 Lighthouse Dr
- 7305 Mira Vista Dr
- 7301 Chaucer Dr
- 1617 Glendora Ct
- 5029 Coral Cove
- 1201 Buena Vista Dr
- 1605 Cordero Ct
- 7100 Frost Ln
- 7620 Waterside Place
- 9005 Harvest Moon Trail
- 9100 Glen Falls Ln
- 9008 Glen Falls Ln
- 9001 Harvest Moon Trail
- 9104 Glen Falls Ln
- 9004 Glen Falls Ln
- 9109 Harvest Moon Trail
- 9004 Harvest Moon Trail
- 9108 Glen Falls Ln
- 9000 Glen Falls Ln
- 8909 Harvest Moon Trail
- 9201 Seven Oaks Ln
- 9000 Harvest Moon Trail
- 9200 Harvest Moon Trail
- 9200 Glen Falls Ln
- 9205 Seven Oaks Ln
- 8904 Glen Falls Ln
- 9005 Seven Oaks Ln
- 8905 Harvest Moon Trail
- 9209 Seven Oaks Ln