9102 Farley Ln Overland Park, KS 66212
Elmhurst NeighborhoodEstimated Value: $353,000 - $412,000
4
Beds
3
Baths
1,560
Sq Ft
$241/Sq Ft
Est. Value
About This Home
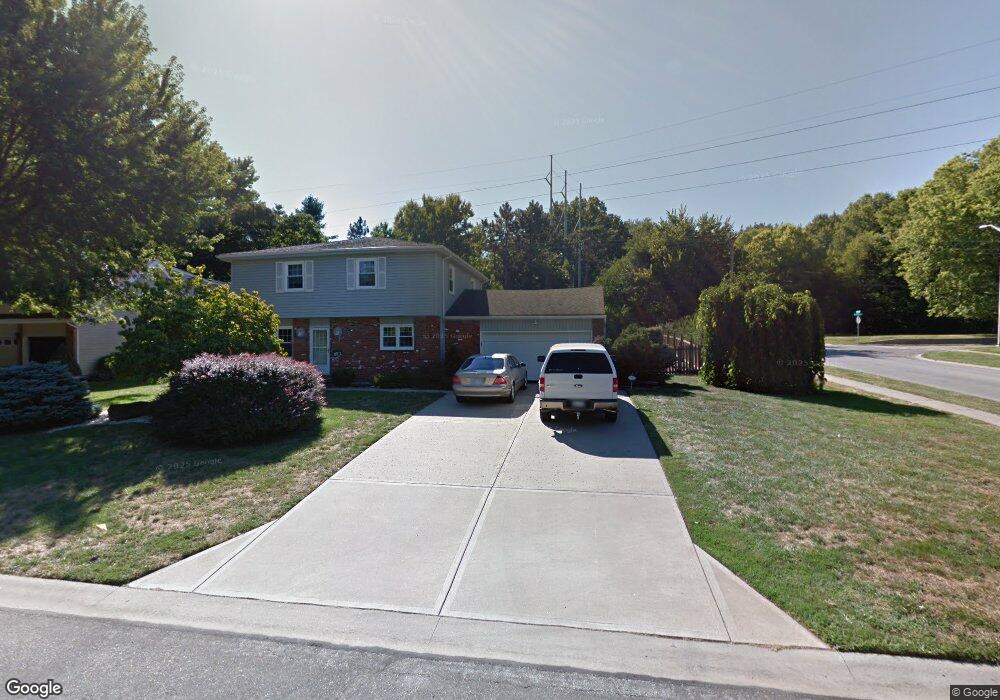
This home is located at 9102 Farley Ln, Overland Park, KS 66212 and is currently estimated at $376,584, approximately $241 per square foot. 9102 Farley Ln is a home located in Johnson County with nearby schools including Pawnee Elementary School, Westridge Middle School, and Shawnee Mission West High School.
Ownership History
Date
Name
Owned For
Owner Type
Purchase Details
Closed on
May 11, 2022
Sold by
Finas Mckinney
Bought by
Rp2wy Llc
Current Estimated Value
Purchase Details
Closed on
Jul 12, 2001
Sold by
Bagley Donald W and Bagley Ginger M
Bought by
Mckinney Finas
Home Financials for this Owner
Home Financials are based on the most recent Mortgage that was taken out on this home.
Original Mortgage
$124,150
Interest Rate
7.18%
Create a Home Valuation Report for This Property
The Home Valuation Report is an in-depth analysis detailing your home's value as well as a comparison with similar homes in the area
Home Values in the Area
Average Home Value in this Area
Purchase History
| Date | Buyer | Sale Price | Title Company |
|---|---|---|---|
| Rp2wy Llc | $250,000 | New Title Company Name | |
| Mckinney Finas | -- | Chicago Title Insurance Co |
Source: Public Records
Mortgage History
| Date | Status | Borrower | Loan Amount |
|---|---|---|---|
| Previous Owner | Mckinney Finas | $124,150 |
Source: Public Records
Tax History Compared to Growth
Tax History
| Year | Tax Paid | Tax Assessment Tax Assessment Total Assessment is a certain percentage of the fair market value that is determined by local assessors to be the total taxable value of land and additions on the property. | Land | Improvement |
|---|---|---|---|---|
| 2024 | $3,689 | $38,353 | $7,311 | $31,042 |
| 2023 | $3,444 | $35,248 | $7,311 | $27,937 |
| 2022 | $3,791 | $33,178 | $7,311 | $25,867 |
| 2021 | $3,714 | $29,026 | $6,087 | $22,939 |
| 2020 | $3,563 | $28,244 | $4,686 | $23,558 |
| 2019 | $3,291 | $25,737 | $3,766 | $21,971 |
| 2018 | $3,465 | $23,805 | $3,766 | $20,039 |
| 2017 | $2,239 | $21,562 | $3,766 | $17,796 |
| 2016 | $2,206 | $20,895 | $3,766 | $17,129 |
| 2015 | $2,042 | $19,757 | $3,766 | $15,991 |
| 2013 | -- | $18,722 | $3,766 | $14,956 |
Source: Public Records
Map
Nearby Homes