Estimated Value: $416,000 - $588,000
4
Beds
2
Baths
1,820
Sq Ft
$290/Sq Ft
Est. Value
About This Home
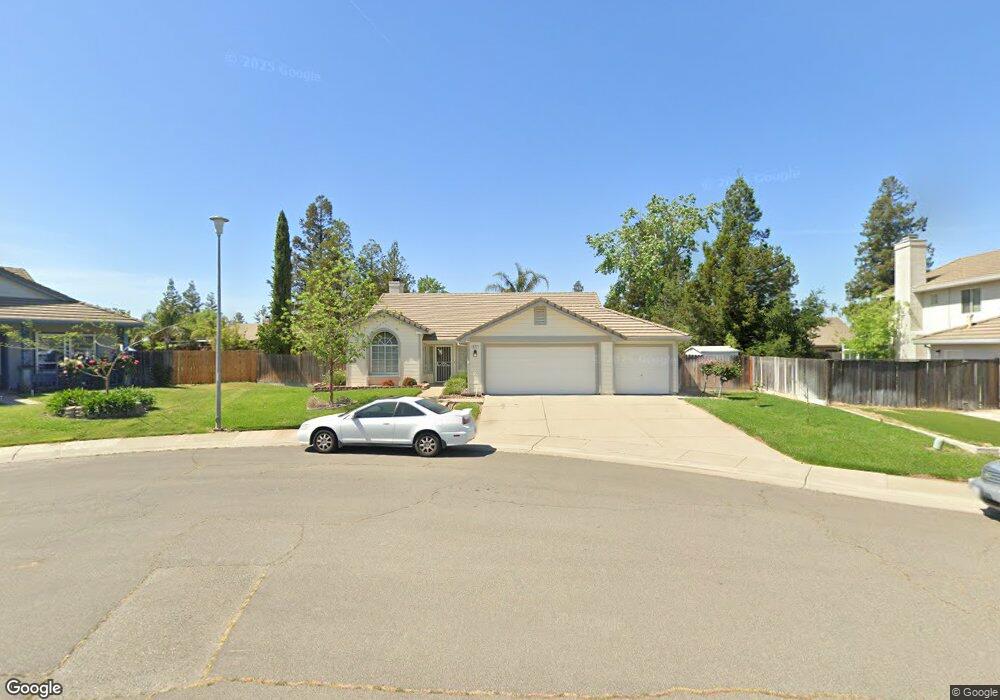
This home is located at 911 Courtenay Ct, Galt, CA 95632 and is currently estimated at $527,646, approximately $289 per square foot. 911 Courtenay Ct is a home located in Sacramento County with nearby schools including Marengo Ranch Elementary School, Robert L. McCaffrey Middle School, and Liberty Ranch High School.
Ownership History
Date
Name
Owned For
Owner Type
Purchase Details
Closed on
Dec 10, 2015
Sold by
Filice Theresa Edna
Bought by
Filice Theresa Edna and Theresa Edna Filice Revocable
Current Estimated Value
Purchase Details
Closed on
Jul 13, 2015
Sold by
Magadia Filice Theresa Edna and Magadia Mccoy Theresa E
Bought by
Filice Theresa Edna
Home Financials for this Owner
Home Financials are based on the most recent Mortgage that was taken out on this home.
Original Mortgage
$129,525
Interest Rate
4.01%
Mortgage Type
New Conventional
Purchase Details
Closed on
Jan 16, 2004
Sold by
Mccoy David Alan
Bought by
Magadia Mccoy Theresa E
Home Financials for this Owner
Home Financials are based on the most recent Mortgage that was taken out on this home.
Original Mortgage
$150,000
Interest Rate
5.79%
Mortgage Type
Unknown
Purchase Details
Closed on
Oct 21, 1993
Sold by
Morrison Homes
Bought by
Mccoy David Alan and Magadia Mccoy Theresa E
Create a Home Valuation Report for This Property
The Home Valuation Report is an in-depth analysis detailing your home's value as well as a comparison with similar homes in the area
Home Values in the Area
Average Home Value in this Area
Purchase History
| Date | Buyer | Sale Price | Title Company |
|---|---|---|---|
| Filice Theresa Edna | -- | None Available | |
| Filice Theresa Edna | -- | None Available | |
| Filice Theresa Edna | -- | None Available | |
| Magadia Mccoy Theresa E | $60,000 | -- | |
| Mccoy David Alan | $161,000 | Chicago Title Company |
Source: Public Records
Mortgage History
| Date | Status | Borrower | Loan Amount |
|---|---|---|---|
| Previous Owner | Filice Theresa Edna | $129,525 | |
| Previous Owner | Magadia Mccoy Theresa E | $150,000 | |
| Previous Owner | Magadia Mccoy Theresa E | $100,000 |
Source: Public Records
Tax History Compared to Growth
Tax History
| Year | Tax Paid | Tax Assessment Tax Assessment Total Assessment is a certain percentage of the fair market value that is determined by local assessors to be the total taxable value of land and additions on the property. | Land | Improvement |
|---|---|---|---|---|
| 2025 | $3,170 | $272,848 | $67,967 | $204,881 |
| 2024 | $3,170 | $267,499 | $66,635 | $200,864 |
| 2023 | $3,119 | $262,255 | $65,329 | $196,926 |
| 2022 | $3,413 | $257,114 | $64,049 | $193,065 |
| 2021 | $3,416 | $252,074 | $62,794 | $189,280 |
| 2020 | $3,393 | $249,491 | $62,151 | $187,340 |
| 2019 | $3,323 | $244,600 | $60,933 | $183,667 |
| 2018 | $3,319 | $239,805 | $59,739 | $180,066 |
| 2017 | $3,211 | $235,104 | $58,568 | $176,536 |
| 2016 | $3,132 | $230,495 | $57,420 | $173,075 |
| 2015 | $3,378 | $227,034 | $56,558 | $170,476 |
| 2014 | $2,968 | $184,433 | $46,108 | $138,325 |
Source: Public Records
Map
Nearby Homes
- 908 Wildbrook Ct
- 1054 Starbrook Dr
- 866 Golden Heights Dr
- 843 Lake Park Cir
- 829 Lake Park Cir
- 825 Lake Park Cir
- 821 Lake Park Cir
- 1156 Monique St
- 1160 Monique St
- Residence 1883 Plan at The Cottages at Greenwood
- 2012 Seraphina St
- Residence 2448 Plan at Summerfield - Cedar Grove at Summerfield
- Residence 2760 Plan at Summerfield - Cedar Glen at Summerfield
- 1173 Monique St
- Residence 3308 Plan at Summerfield - Cedar Glen at Summerfield
- 1164 Monique St
- Residence 2072 Plan at The Towns at Greenwood
- Residence 2788 Plan at Summerfield - Cedar Glen at Summerfield
- 1169 Monique St
- 2016 Seraphina St
- 915 Courtenay Ct
- 907 Courtenay Ct
- 904 Lake Canyon Ave
- 908 Lake Canyon Ave
- 912 Lake Canyon Ave
- 900 Lake Canyon Ave
- 919 Courtenay Ct
- 908 Courtenay Ct
- 916 Lake Canyon Ave
- 912 Courtenay Ct
- 916 Courtenay Ct
- 920 Courtenay Ct
- 920 Lake Canyon Ave
- 923 Courtenay Ct
- 913 Lake Canyon Ave
- 909 Lake Canyon Ave
- 917 Lake Canyon Ave
- 905 Lake Canyon Ave
- 1058 Cedar Canyon Cir
- 911 Wildbrook Ct