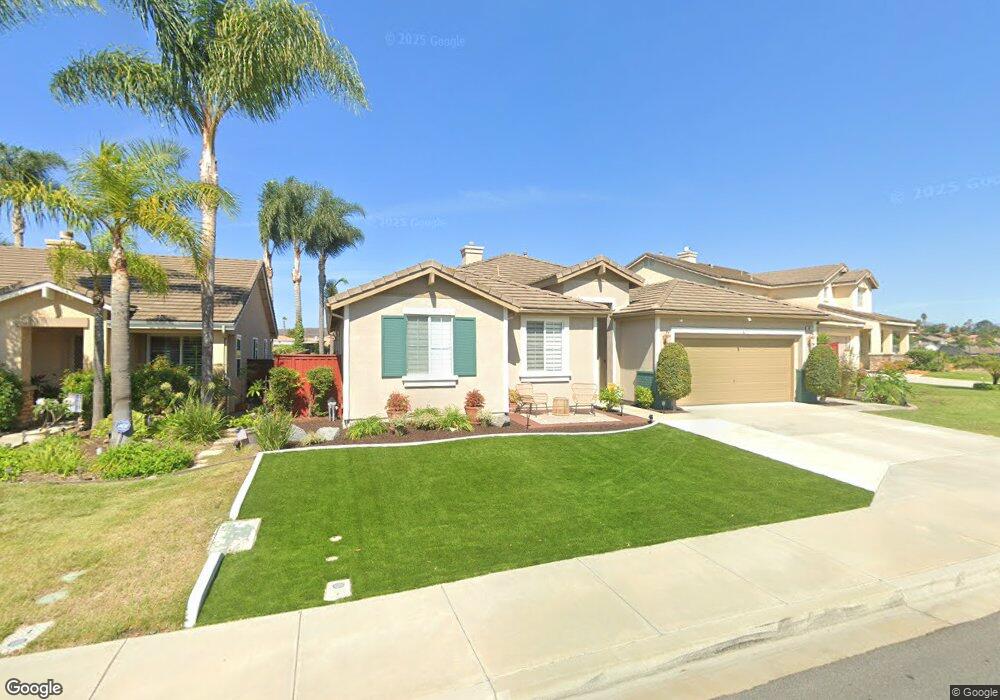
911 Niguel St Unit II Oceanside, CA 92057
North Valley NeighborhoodEstimated Value: $868,413 - $969,000
3
Beds
2
Baths
2,069
Sq Ft
$451/Sq Ft
Est. Value
About This Home
This home is located at 911 Niguel St Unit II, Oceanside, CA 92057 and is currently estimated at $933,853, approximately $451 per square foot. 911 Niguel St Unit II is a home located in San Diego County with nearby schools including Reynolds Elementary School, Cesar Chavez Middle School, and Peppertree Montessori School.
Ownership History
Date
Name
Owned For
Owner Type
Purchase Details
Closed on
Apr 4, 2012
Sold by
Brown George B and Brown Carolyn M
Bought by
Brown G and Brown C
Current Estimated Value
Home Financials for this Owner
Home Financials are based on the most recent Mortgage that was taken out on this home.
Original Mortgage
$142,000
Outstanding Balance
$19,146
Interest Rate
3.86%
Mortgage Type
New Conventional
Estimated Equity
$914,707
Purchase Details
Closed on
Dec 6, 2010
Sold by
Brown G and Brown C
Bought by
Brown G and Brown C
Purchase Details
Closed on
Mar 29, 2002
Sold by
Pinnacle Oceanside 104 Lp
Bought by
Brown George B and Brown Carolyn M
Home Financials for this Owner
Home Financials are based on the most recent Mortgage that was taken out on this home.
Original Mortgage
$183,000
Interest Rate
6.37%
Create a Home Valuation Report for This Property
The Home Valuation Report is an in-depth analysis detailing your home's value as well as a comparison with similar homes in the area
Home Values in the Area
Average Home Value in this Area
Purchase History
| Date | Buyer | Sale Price | Title Company |
|---|---|---|---|
| Brown G | -- | Chicago Title Company | |
| Brown George B | -- | Chicago Title Company | |
| Brown G | -- | None Available | |
| Brown George B | $323,500 | Chicago Title Co |
Source: Public Records
Mortgage History
| Date | Status | Borrower | Loan Amount |
|---|---|---|---|
| Open | Brown George B | $142,000 | |
| Previous Owner | Brown George B | $183,000 |
Source: Public Records
Tax History Compared to Growth
Tax History
| Year | Tax Paid | Tax Assessment Tax Assessment Total Assessment is a certain percentage of the fair market value that is determined by local assessors to be the total taxable value of land and additions on the property. | Land | Improvement |
|---|---|---|---|---|
| 2025 | $5,259 | $477,554 | $173,788 | $303,766 |
| 2024 | $5,259 | $468,191 | $170,381 | $297,810 |
| 2023 | $5,095 | $459,012 | $167,041 | $291,971 |
| 2022 | $5,015 | $450,013 | $163,766 | $286,247 |
| 2021 | $5,029 | $441,190 | $160,555 | $280,635 |
| 2020 | $4,874 | $436,667 | $158,909 | $277,758 |
| 2019 | $4,732 | $428,106 | $155,794 | $272,312 |
| 2018 | $4,680 | $419,713 | $152,740 | $266,973 |
| 2017 | $4,592 | $411,485 | $149,746 | $261,739 |
| 2016 | $4,442 | $403,417 | $146,810 | $256,607 |
| 2015 | $4,312 | $397,358 | $144,605 | $252,753 |
| 2014 | $3,938 | $370,000 | $134,000 | $236,000 |
Source: Public Records
Map
Nearby Homes
- 871 Niguel St
- 675 Parker St
- 671 Parker St
- 5108 Eliot St
- 5014 El Mirlo Dr
- 1061 Boulder Place
- 5116 Weymouth Way
- 1247 Bellingham Dr
- 1120 Parkview Dr
- 1049 Boulder Place
- 1447 Puritan Dr
- 0 Indian View Dr
- 1105 Breakaway Dr
- 1479 Puritan Dr
- 1473 Salem Ct
- 1477 Salem Ct
- 1125 Midnight Way
- 4795 Stephanie Place
- 530 Roja Dr
- 0 Village Dr
- 907 Niguel St
- 915 Niguel St
- 903 Niguel St
- 4872 Castellano Dr
- 910 Niguel St
- 914 Niguel St
- 906 Niguel St
- 4868 Castellano Dr
- 918 Niguel St
- 902 Niguel St
- 922 Niguel St
- 4897 Castellano Dr
- 926 Niguel St Unit II
- 896 Arvita Ct
- 4879 Castellano Dr
- 909 Glendora Dr
- 913 Glendora Dr
- 905 Glendora Dr
- 898 Niguel St
- 917 Glendora Dr