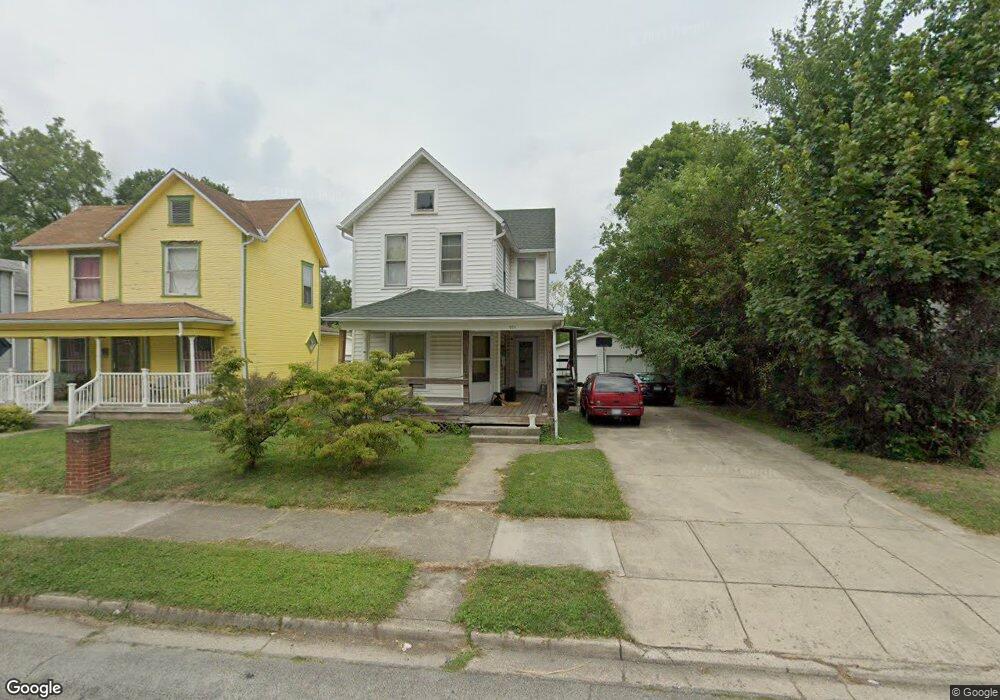
911 Oak St Springfield, OH 45505
Estimated Value: $51,000 - $124,000
2
Beds
1
Bath
1,176
Sq Ft
$70/Sq Ft
Est. Value
About This Home
This home is located at 911 Oak St, Springfield, OH 45505 and is currently estimated at $82,315, approximately $69 per square foot. 911 Oak St is a home located in Clark County with nearby schools including Kenwood Elementary School, Hayward Middle School, and Springfield High School.
Ownership History
Date
Name
Owned For
Owner Type
Purchase Details
Closed on
Sep 15, 2022
Sold by
Benfield Wanda J and Benfield Johnny
Bought by
Elliott William E
Current Estimated Value
Purchase Details
Closed on
Nov 11, 2010
Sold by
Banfield Dwayne O and Banfield Wanda J
Bought by
Banfield Benjamin B and Banfield Angela M
Purchase Details
Closed on
Jun 27, 2007
Sold by
Jpmorgan Chase Bank Na
Bought by
Banfield Dwayne O and Banfield Wanda J
Purchase Details
Closed on
Jan 19, 2007
Sold by
St John Jesse and St John Marie
Bought by
Jpmorgan Chase Bank Na and Equity One Abs Inc Mortgage Pass Through
Purchase Details
Closed on
Jan 15, 1992
Create a Home Valuation Report for This Property
The Home Valuation Report is an in-depth analysis detailing your home's value as well as a comparison with similar homes in the area
Home Values in the Area
Average Home Value in this Area
Purchase History
| Date | Buyer | Sale Price | Title Company |
|---|---|---|---|
| Elliott William E | $45,000 | -- | |
| Elliott William E | $45,000 | None Listed On Document | |
| Banfield Benjamin B | -- | Attorney | |
| Banfield Dwayne O | $27,800 | Accutitle Agency Inc | |
| Jpmorgan Chase Bank Na | $30,000 | None Available | |
| -- | -- | -- |
Source: Public Records
Tax History Compared to Growth
Tax History
| Year | Tax Paid | Tax Assessment Tax Assessment Total Assessment is a certain percentage of the fair market value that is determined by local assessors to be the total taxable value of land and additions on the property. | Land | Improvement |
|---|---|---|---|---|
| 2024 | $1,073 | $21,720 | $2,470 | $19,250 |
| 2023 | $1,073 | $21,720 | $2,470 | $19,250 |
| 2022 | $1,102 | $21,720 | $2,470 | $19,250 |
| 2021 | $1,102 | $20,050 | $2,250 | $17,800 |
| 2020 | $1,104 | $20,050 | $2,250 | $17,800 |
| 2019 | $1,107 | $20,050 | $2,250 | $17,800 |
| 2018 | $969 | $16,840 | $1,870 | $14,970 |
| 2017 | $968 | $16,843 | $1,873 | $14,970 |
| 2016 | $969 | $16,843 | $1,873 | $14,970 |
| 2015 | $988 | $16,843 | $1,873 | $14,970 |
| 2014 | $984 | $16,843 | $1,873 | $14,970 |
| 2013 | $974 | $16,843 | $1,873 | $14,970 |
Source: Public Records
Map
Nearby Homes
- 842 Oak St
- 1024 Elder St
- 1102 Pine St
- 902 Cypress St
- 710-712 Cypress St
- 1159 Selma Rd
- 453 E Pleasant St
- 1047 Cypress St
- 905 Rice St
- 1210 Burt St
- 705 York St
- 1435 Logan Ave
- 1562 Rutland Ave
- 360 S Greenmount Ave
- 1609 Irwin Ave
- 1225 Beacon St
- 550 E Rose St
- 1714 Kenton St
- 321 Glenn Ave
- 603 Linwood Ave Unit 605