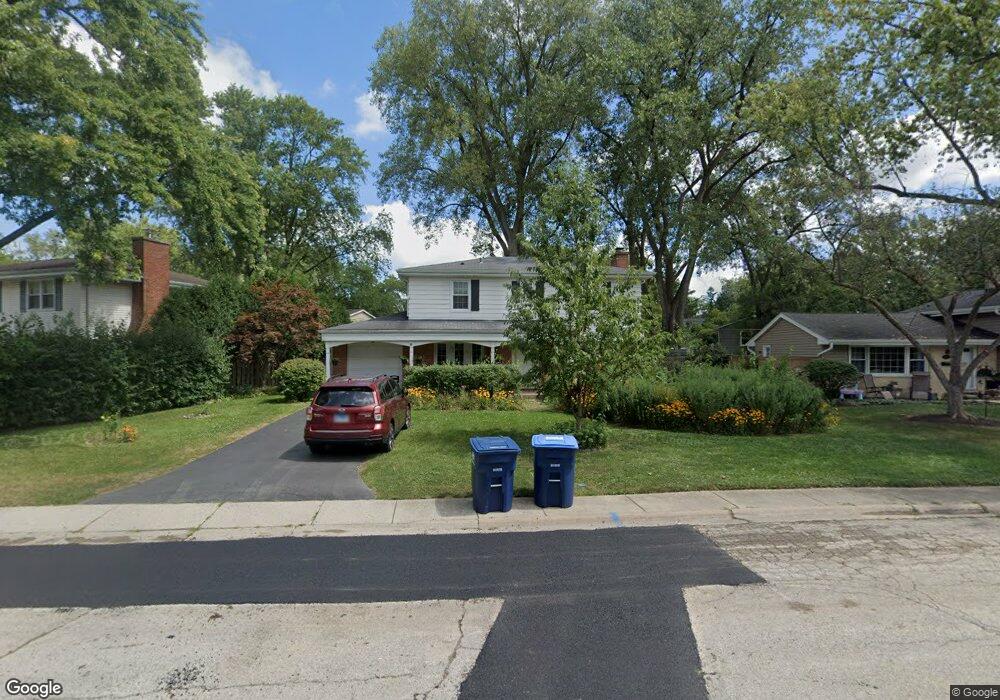
911 Stratford Rd Deerfield, IL 60015
Estimated Value: $626,975 - $715,000
5
Beds
2
Baths
2,250
Sq Ft
$307/Sq Ft
Est. Value
About This Home
This home is located at 911 Stratford Rd, Deerfield, IL 60015 and is currently estimated at $691,244, approximately $307 per square foot. 911 Stratford Rd is a home located in Lake County with nearby schools including Wilmot Elementary School, Charles J Caruso Middle School, and Deerfield High School.
Ownership History
Date
Name
Owned For
Owner Type
Purchase Details
Closed on
Oct 13, 2020
Sold by
Sanabria James B
Bought by
Sanabria James B and James B Sanabria Trust
Current Estimated Value
Purchase Details
Closed on
Jan 5, 2009
Sold by
Gabrielsen Gary A and Gabrielsen Mary Jane
Bought by
Sanabria James B
Home Financials for this Owner
Home Financials are based on the most recent Mortgage that was taken out on this home.
Original Mortgage
$296,250
Outstanding Balance
$186,252
Interest Rate
5.08%
Mortgage Type
Purchase Money Mortgage
Estimated Equity
$504,992
Purchase Details
Closed on
Dec 17, 1993
Sold by
Hurley James A and Hurley Valerie J
Bought by
Gabrielsen Gary A and Gabrielsen Mary Jane
Home Financials for this Owner
Home Financials are based on the most recent Mortgage that was taken out on this home.
Original Mortgage
$193,500
Interest Rate
7.35%
Create a Home Valuation Report for This Property
The Home Valuation Report is an in-depth analysis detailing your home's value as well as a comparison with similar homes in the area
Home Values in the Area
Average Home Value in this Area
Purchase History
| Date | Buyer | Sale Price | Title Company |
|---|---|---|---|
| Sanabria James B | -- | Attorney | |
| Sanabria James B | $395,000 | Multiple | |
| Gabrielsen Gary A | $143,333 | -- |
Source: Public Records
Mortgage History
| Date | Status | Borrower | Loan Amount |
|---|---|---|---|
| Open | Sanabria James B | $296,250 | |
| Previous Owner | Gabrielsen Gary A | $193,500 |
Source: Public Records
Tax History Compared to Growth
Tax History
| Year | Tax Paid | Tax Assessment Tax Assessment Total Assessment is a certain percentage of the fair market value that is determined by local assessors to be the total taxable value of land and additions on the property. | Land | Improvement |
|---|---|---|---|---|
| 2024 | $14,530 | $160,861 | $46,619 | $114,242 |
| 2023 | $15,147 | $154,377 | $44,740 | $109,637 |
| 2022 | $15,147 | $159,866 | $48,056 | $111,810 |
| 2021 | $14,308 | $154,132 | $46,332 | $107,800 |
| 2020 | $13,760 | $154,457 | $46,430 | $108,027 |
| 2019 | $13,439 | $154,195 | $46,351 | $107,844 |
| 2018 | $7,630 | $140,782 | $49,129 | $91,653 |
| 2017 | $11,691 | $140,333 | $48,972 | $91,361 |
| 2016 | $11,384 | $135,026 | $47,120 | $87,906 |
| 2015 | $11,175 | $126,868 | $44,273 | $82,595 |
| 2014 | $10,109 | $113,077 | $44,588 | $68,489 |
| 2012 | $9,846 | $112,080 | $44,195 | $67,885 |
Source: Public Records
Map
Nearby Homes
- 934 Wayne Ave
- 1103 Hazel Ave
- 926 Cedar St
- 745 Price Ln
- 904 Forest Ave
- 1045 Fairoaks Ave
- 816 Appletree Ln
- 677 Timber Hill Rd
- 1038 Brookside Ln
- 1009 Central Ave
- 956 Brookside Ln
- 1131 Linden Ave
- 970 Ivy Ln Unit C
- 1119 Hampton Ct Unit 1
- 517 Appletree Ln
- 1410 Berkley Ct
- 730 Castlewood Ln
- 1265 Woodland Dr
- 610 Robert York Ave Unit 104
- 1660 Hertel Ln
- 921 Stratford Rd
- 901 Stratford Rd
- 914 Wayne Ave
- 920 Wayne Ave
- 923 Stratford Rd
- 918 Stratford Rd
- 924 Wayne Ave
- 900 Wayne Ave
- 920 Stratford Rd
- 929 Stratford Rd
- 1224 Holly Ln
- 930 Wayne Ave
- 924 Stratford Rd
- 933 Stratford Rd
- 930 Stratford Rd
- 1228 Holly Ln
- 923 Wayne Ave
- 931 Wayne Ave
- 1218 Arbor Vitae Rd
- 917 Wayne Ave