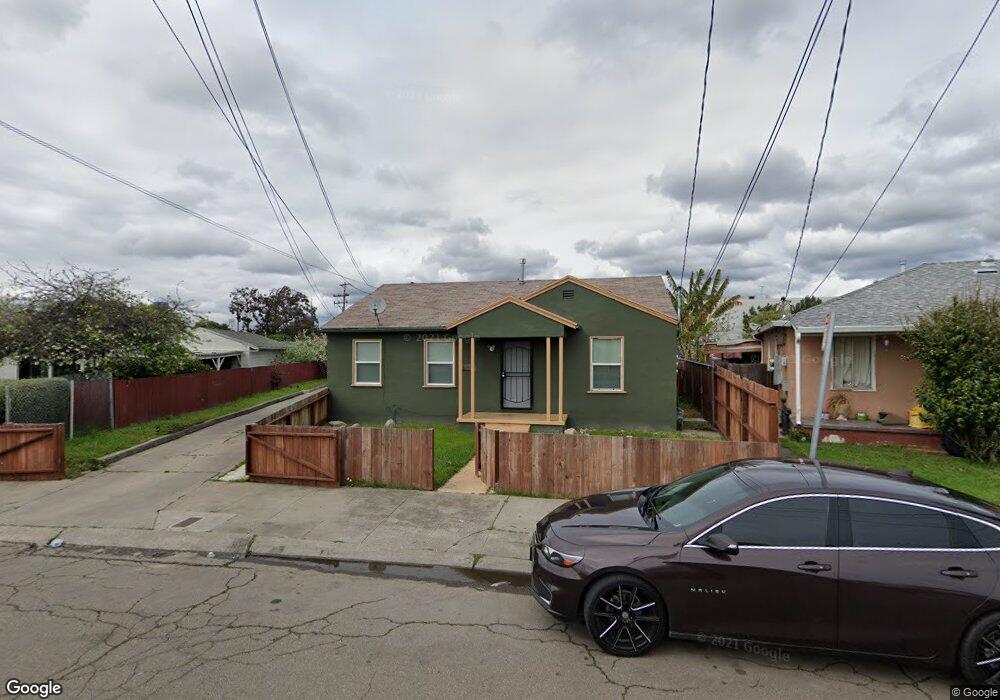
9110 Date St Oakland, CA 94603
Highland NeighborhoodEstimated Value: $655,000 - $928,000
7
Beds
3
Baths
2,523
Sq Ft
$315/Sq Ft
Est. Value
About This Home
This home is located at 9110 Date St, Oakland, CA 94603 and is currently estimated at $795,000, approximately $315 per square foot. 9110 Date St is a home located in Alameda County with nearby schools including Brookfield Elementary School, Madison Park Academy (6-12), and Coliseum College Prep Academy.
Ownership History
Date
Name
Owned For
Owner Type
Purchase Details
Closed on
Aug 23, 2016
Sold by
Adams Cyrinthia
Bought by
Adams Johnnie
Current Estimated Value
Purchase Details
Closed on
Aug 3, 2016
Sold by
Adams Johnnie
Bought by
Chambers Jessie V
Purchase Details
Closed on
Jan 12, 2011
Sold by
Adams Johnnie and Willie Mae Mcfield Trust
Bought by
Adams Johnnie
Purchase Details
Closed on
Jul 9, 2010
Sold by
Mcfield Willie Mae
Bought by
Mcfield Willie Mae and Adams Johnnie
Create a Home Valuation Report for This Property
The Home Valuation Report is an in-depth analysis detailing your home's value as well as a comparison with similar homes in the area
Home Values in the Area
Average Home Value in this Area
Purchase History
| Date | Buyer | Sale Price | Title Company |
|---|---|---|---|
| Adams Johnnie | -- | Lawyers Title Company | |
| Chambers Jessie V | -- | Lawyers Title Company | |
| Adams Johnnie | -- | None Available | |
| Mcfield Willie Mae | -- | None Available |
Source: Public Records
Tax History
| Year | Tax Paid | Tax Assessment Tax Assessment Total Assessment is a certain percentage of the fair market value that is determined by local assessors to be the total taxable value of land and additions on the property. | Land | Improvement |
|---|---|---|---|---|
| 2025 | $8,888 | $319,153 | $185,689 | $133,464 |
| 2024 | $8,888 | $312,897 | $182,049 | $130,848 |
| 2023 | $9,546 | $306,762 | $178,480 | $128,282 |
| 2022 | $8,538 | $300,747 | $174,980 | $125,767 |
| 2021 | $13,482 | $294,851 | $171,550 | $123,301 |
| 2020 | $6,333 | $291,830 | $169,792 | $122,038 |
| 2019 | $7,524 | $286,110 | $166,464 | $119,646 |
| 2018 | $5,658 | $280,500 | $163,200 | $117,300 |
| 2017 | $5,357 | $275,000 | $160,000 | $115,000 |
| 2016 | $5,264 | $189,393 | $56,818 | $132,575 |
| 2015 | $5,379 | $186,550 | $55,965 | $130,585 |
| 2014 | $5,480 | $182,895 | $54,868 | $128,027 |
Source: Public Records
Map
Nearby Homes
Your Personal Tour Guide
Ask me questions while you tour the home.