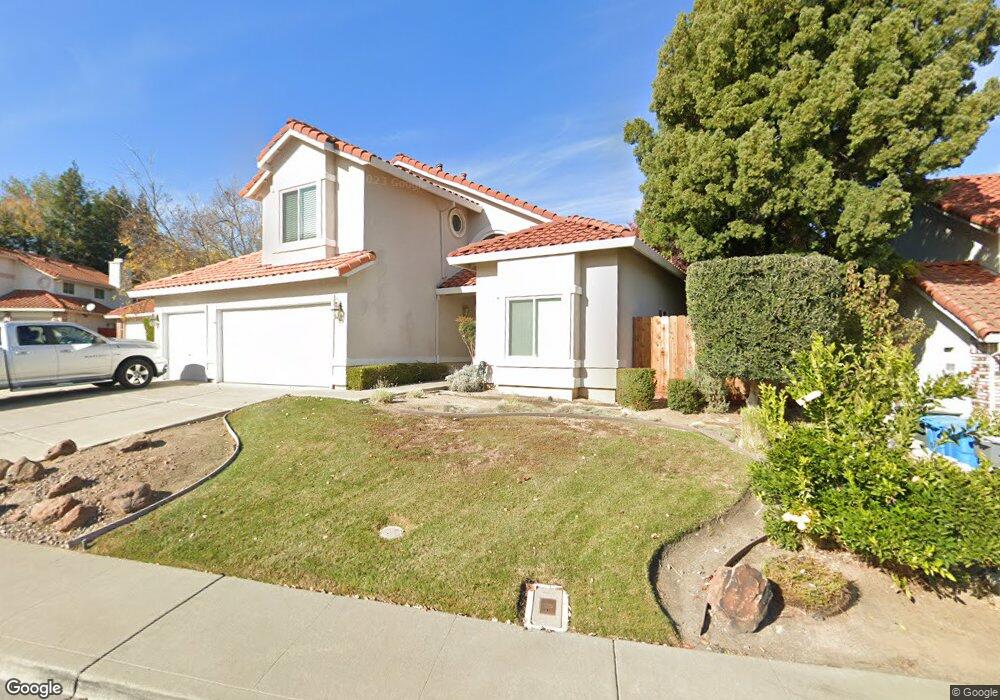
912 Quate Ct Vacaville, CA 95688
Estimated Value: $762,000 - $841,000
5
Beds
3
Baths
2,286
Sq Ft
$346/Sq Ft
Est. Value
About This Home
This home is located at 912 Quate Ct, Vacaville, CA 95688 and is currently estimated at $790,210, approximately $345 per square foot. 912 Quate Ct is a home located in Solano County with nearby schools including Browns Valley Elementary School, Willis Jepson Middle School, and Vacaville High School.
Ownership History
Date
Name
Owned For
Owner Type
Purchase Details
Closed on
Aug 7, 2015
Sold by
Turk Gary L and Turk Katherine D
Bought by
The Gary Turk & Katherine Dolene Turk Re
Current Estimated Value
Home Financials for this Owner
Home Financials are based on the most recent Mortgage that was taken out on this home.
Original Mortgage
$423,530
Interest Rate
4.05%
Mortgage Type
VA
Purchase Details
Closed on
Nov 7, 2014
Sold by
Turk Gary Lee and Turk Katherine Dolene
Bought by
Turk Gary and Turk Katherine Dolene
Purchase Details
Closed on
Jun 2, 1995
Sold by
Gesner Ronald H and Gesner Kathleen M
Bought by
Turk Gary Lee and Turk Katherine Dolene
Home Financials for this Owner
Home Financials are based on the most recent Mortgage that was taken out on this home.
Original Mortgage
$242,250
Interest Rate
7.75%
Create a Home Valuation Report for This Property
The Home Valuation Report is an in-depth analysis detailing your home's value as well as a comparison with similar homes in the area
Home Values in the Area
Average Home Value in this Area
Purchase History
| Date | Buyer | Sale Price | Title Company |
|---|---|---|---|
| The Gary Turk & Katherine Dolene Turk Re | -- | Old Republic Title Company | |
| Turk Gary L | -- | Old Republic Title Company | |
| Turk Gary | -- | None Available | |
| Turk Gary Lee | $255,000 | Chicago Title Company |
Source: Public Records
Mortgage History
| Date | Status | Borrower | Loan Amount |
|---|---|---|---|
| Previous Owner | Turk Gary L | $423,530 | |
| Previous Owner | Turk Gary Lee | $242,250 |
Source: Public Records
Tax History Compared to Growth
Tax History
| Year | Tax Paid | Tax Assessment Tax Assessment Total Assessment is a certain percentage of the fair market value that is determined by local assessors to be the total taxable value of land and additions on the property. | Land | Improvement |
|---|---|---|---|---|
| 2025 | $9,148 | $428,301 | $83,975 | $344,326 |
| 2024 | $9,148 | $419,904 | $82,329 | $337,575 |
| 2023 | $9,030 | $411,671 | $80,715 | $330,956 |
| 2022 | $8,937 | $403,600 | $79,134 | $324,466 |
| 2021 | $8,943 | $395,687 | $77,583 | $318,104 |
| 2020 | $8,830 | $391,631 | $76,788 | $314,843 |
| 2019 | $8,744 | $383,953 | $75,283 | $308,670 |
| 2018 | $8,683 | $376,425 | $73,807 | $302,618 |
| 2017 | $8,489 | $369,045 | $72,360 | $296,685 |
| 2016 | $4,384 | $361,810 | $70,942 | $290,868 |
| 2015 | $4,323 | $356,376 | $69,877 | $286,499 |
| 2014 | -- | $349,396 | $68,509 | $280,887 |
Source: Public Records
Map
Nearby Homes
- 930 Quate Ct
- 830 Swindon Ct
- 231 Ballindine Dr
- 0 Seneca Ct
- 136 Pepperell Ct
- 267 Sunridge Way
- 381 Shannon Dr
- 6021 N Vine St
- 249 Milford Ct
- 348 Vine St
- 101 Silver Eagle Way
- 2030 Pinecrest Ct
- 2018 Pinecrest Ct
- 256 Vine St
- 1030 Mulberry Ct
- 218 Donegal Ct
- 734 Shannon Dr
- 2136 Vineyard Hills Ct
- 606 Roscommon Place
- 6526 Gibson Canyon Rd