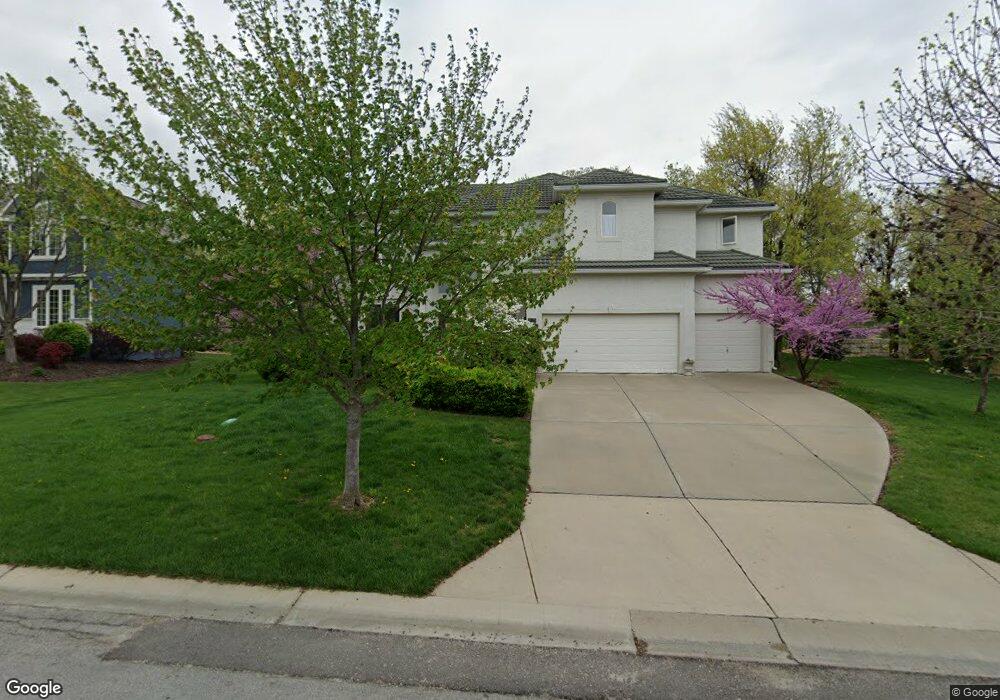
9129 Redbud Ln Lenexa, KS 66220
Estimated Value: $644,000 - $703,000
4
Beds
4
Baths
2,835
Sq Ft
$237/Sq Ft
Est. Value
About This Home
This home is located at 9129 Redbud Ln, Lenexa, KS 66220 and is currently estimated at $671,766, approximately $236 per square foot. 9129 Redbud Ln is a home located in Johnson County with nearby schools including Manchester Park Elementary School, Prairie Trail Middle School, and Olathe Northwest High School.
Ownership History
Date
Name
Owned For
Owner Type
Purchase Details
Closed on
Jan 18, 2022
Sold by
Lind Russell Karen
Bought by
Russell Karen Lind and Lind James Edward
Current Estimated Value
Purchase Details
Closed on
Jun 30, 2004
Sold by
Glen A Mock Construction & Design Inc
Bought by
Russell Shawn B and Russell Karen Lind
Home Financials for this Owner
Home Financials are based on the most recent Mortgage that was taken out on this home.
Original Mortgage
$270,000
Interest Rate
6.31%
Mortgage Type
Purchase Money Mortgage
Purchase Details
Closed on
Nov 23, 2003
Sold by
Royal Heights Inc
Bought by
Glen A Mock Construction & Design Inc
Home Financials for this Owner
Home Financials are based on the most recent Mortgage that was taken out on this home.
Original Mortgage
$308,000
Interest Rate
6.02%
Mortgage Type
Construction
Create a Home Valuation Report for This Property
The Home Valuation Report is an in-depth analysis detailing your home's value as well as a comparison with similar homes in the area
Home Values in the Area
Average Home Value in this Area
Purchase History
| Date | Buyer | Sale Price | Title Company |
|---|---|---|---|
| Russell Karen Lind | -- | -- | |
| Russell Shawn B | -- | Security Land Title Company | |
| Glen A Mock Construction & Design Inc | -- | Security Land Title Company |
Source: Public Records
Mortgage History
| Date | Status | Borrower | Loan Amount |
|---|---|---|---|
| Previous Owner | Russell Shawn B | $270,000 | |
| Previous Owner | Glen A Mock Construction & Design Inc | $308,000 |
Source: Public Records
Tax History Compared to Growth
Tax History
| Year | Tax Paid | Tax Assessment Tax Assessment Total Assessment is a certain percentage of the fair market value that is determined by local assessors to be the total taxable value of land and additions on the property. | Land | Improvement |
|---|---|---|---|---|
| 2024 | $8,575 | $69,679 | $17,141 | $52,538 |
| 2023 | $8,449 | $67,505 | $14,911 | $52,594 |
| 2022 | $8,022 | $62,514 | $14,193 | $48,321 |
| 2021 | $7,594 | $56,361 | $14,193 | $42,168 |
| 2020 | $9,034 | $55,269 | $14,193 | $41,076 |
| 2019 | $8,953 | $54,775 | $12,817 | $41,958 |
| 2018 | $7,247 | $52,291 | $12,817 | $39,474 |
| 2017 | $8,406 | $48,737 | $11,655 | $37,082 |
| 2016 | $6,820 | $49,243 | $11,655 | $37,588 |
| 2015 | $6,672 | $48,185 | $11,651 | $36,534 |
| 2013 | -- | $45,805 | $11,651 | $34,154 |
Source: Public Records
Map
Nearby Homes
- 20308 W 92nd St
- 20825 W 94th Terrace
- 20415 W 88th Terrace
- 21359 W 93rd Ct
- 9238 Marion St
- 9268 Brownridge St
- 9259 Deer Run St
- 21111 W 95th Terrace
- 8823 Vista Dr
- 9450 Marion St
- 9410 Deer Run St
- 9517 Falcon Ridge Dr
- 20212 W 88th St
- 22068 W 94th Terrace
- 22105 W 94th Terrace
- 22140 W 94th Terrace
- 22092 W 94th Terrace
- 22117 W 94th Terrace
- 22165 W 94th Terrace
- 22116 W 94th Terrace
- 9133 Redbud Ln
- 9125 Redbud Ln
- 20734 W 92nd St
- 9132 Redbud Ln
- 9121 Redbud Ln
- 20805 W 91st Terrace
- 9136 Redbud Ln
- 20730 W 92nd St
- 9117 Redbud Ln
- 20809 W 91st Terrace
- 20733 W 92nd St
- 20804 W 91st Terrace
- 20813 W 91st Terrace
- 9140 Redbud Ln
- 20726 W 92nd St
- 20729 W 92nd St
- 9111 Redbud Ln
- 20808 W 91st Terrace
- 20817 W 91st Terrace
- 9249 Deer Run St