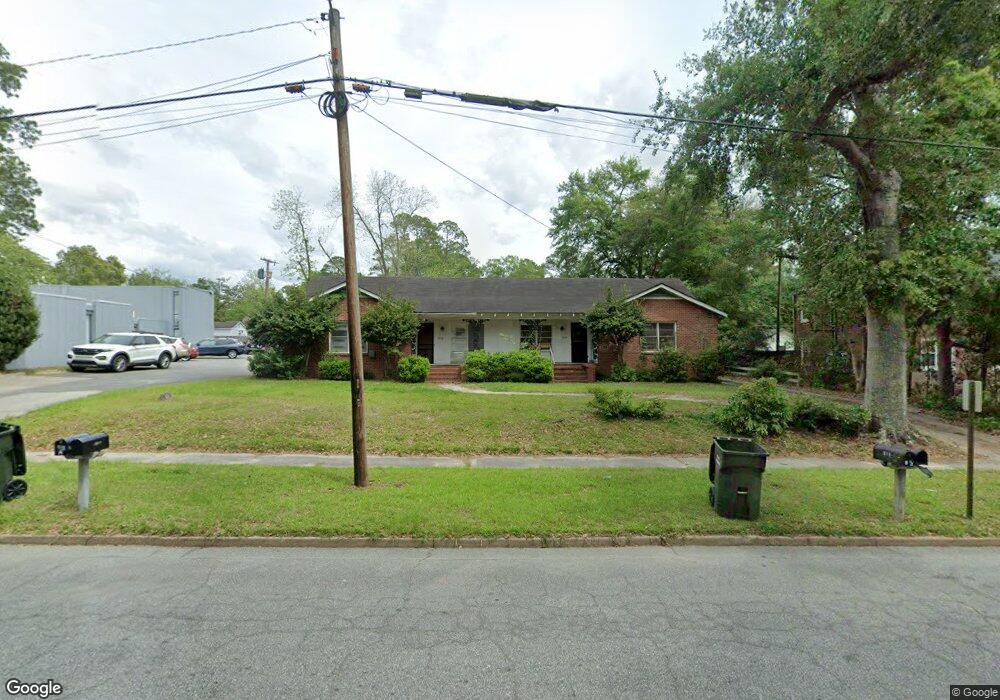
913 1st St SE Unit ABCD Moultrie, GA 31768
Estimated Value: $230,000 - $258,000
6
Beds
4
Baths
3,300
Sq Ft
$75/Sq Ft
Est. Value
About This Home
This home is located at 913 1st St SE Unit ABCD, Moultrie, GA 31768 and is currently estimated at $246,688, approximately $74 per square foot. 913 1st St SE Unit ABCD is a home located in Colquitt County with nearby schools including Stringfellow Elementary School, Willie J. Williams Middle School, and C.A. Gray Junior High School.
Ownership History
Date
Name
Owned For
Owner Type
Purchase Details
Closed on
Oct 14, 2025
Sold by
Goodno Richard E
Bought by
Pine Point Properties Llc
Current Estimated Value
Purchase Details
Closed on
Oct 9, 2025
Sold by
Goodno Richard E
Bought by
Seed Investments Llc
Purchase Details
Closed on
Oct 18, 2019
Sold by
Larry Franklin Properties Inc
Bought by
Hildebrant Loren H and Hildebrant Betty
Purchase Details
Closed on
Dec 5, 2018
Sold by
Joiner Robert M
Bought by
Goodno Richard E
Home Financials for this Owner
Home Financials are based on the most recent Mortgage that was taken out on this home.
Original Mortgage
$142,759
Interest Rate
4.9%
Mortgage Type
New Conventional
Purchase Details
Closed on
Jul 21, 1997
Bought by
Joiner Robert Millsap
Purchase Details
Closed on
May 1, 1974
Bought by
Draffin F M
Create a Home Valuation Report for This Property
The Home Valuation Report is an in-depth analysis detailing your home's value as well as a comparison with similar homes in the area
Home Values in the Area
Average Home Value in this Area
Purchase History
| Date | Buyer | Sale Price | Title Company |
|---|---|---|---|
| Pine Point Properties Llc | $250,000 | -- | |
| Seed Investments Llc | $250,000 | -- | |
| Hildebrant Loren H | $139,900 | -- | |
| Goodno Richard E | $140,000 | -- | |
| Joiner Robert Millsap | $57,500 | -- | |
| Draffin F M | $32,000 | -- |
Source: Public Records
Mortgage History
| Date | Status | Borrower | Loan Amount |
|---|---|---|---|
| Previous Owner | Goodno Richard E | $142,759 |
Source: Public Records
Tax History Compared to Growth
Tax History
| Year | Tax Paid | Tax Assessment Tax Assessment Total Assessment is a certain percentage of the fair market value that is determined by local assessors to be the total taxable value of land and additions on the property. | Land | Improvement |
|---|---|---|---|---|
| 2024 | $2,528 | $71,612 | $3,610 | $68,002 |
| 2023 | $2,162 | $42,258 | $3,610 | $38,648 |
| 2022 | $1,350 | $40,338 | $3,610 | $36,728 |
| 2021 | $1,300 | $38,332 | $3,610 | $34,722 |
| 2020 | $1,258 | $36,476 | $3,610 | $32,866 |
| 2019 | $1,102 | $34,620 | $3,610 | $31,010 |
| 2018 | $1,186 | $29,685 | $3,610 | $26,075 |
| 2017 | $1,140 | $29,685 | $3,610 | $26,075 |
| 2016 | $1,186 | $29,685 | $3,610 | $26,075 |
| 2015 | $1,189 | $29,685 | $3,610 | $26,075 |
| 2014 | $1,218 | $29,685 | $3,610 | $26,075 |
| 2013 | -- | $29,684 | $3,610 | $26,074 |
Source: Public Records
Map
Nearby Homes
- 902 2nd St SE
- 600 1st St SE
- 209 7th Ave SW
- 704 3rd St SW
- 1175 4th St SW
- 515 5th Ave SE Unit 4
- 1160 4th St SW
- 521 5th Ave SE Unit 4
- 210 13th Ave SE
- 1310 S Main St
- 1159 6th St SW
- 717 5th Ave SE
- 40 SE Packer Pride Dr Unit 135
- 40 SE Packer Pride Dr
- 1021 11th Ave SE
- 515 8th St SW
- 610 4th Ave SW
- 407 1st Ave SE
- 221 6th St SW
- 00 Southern Trail