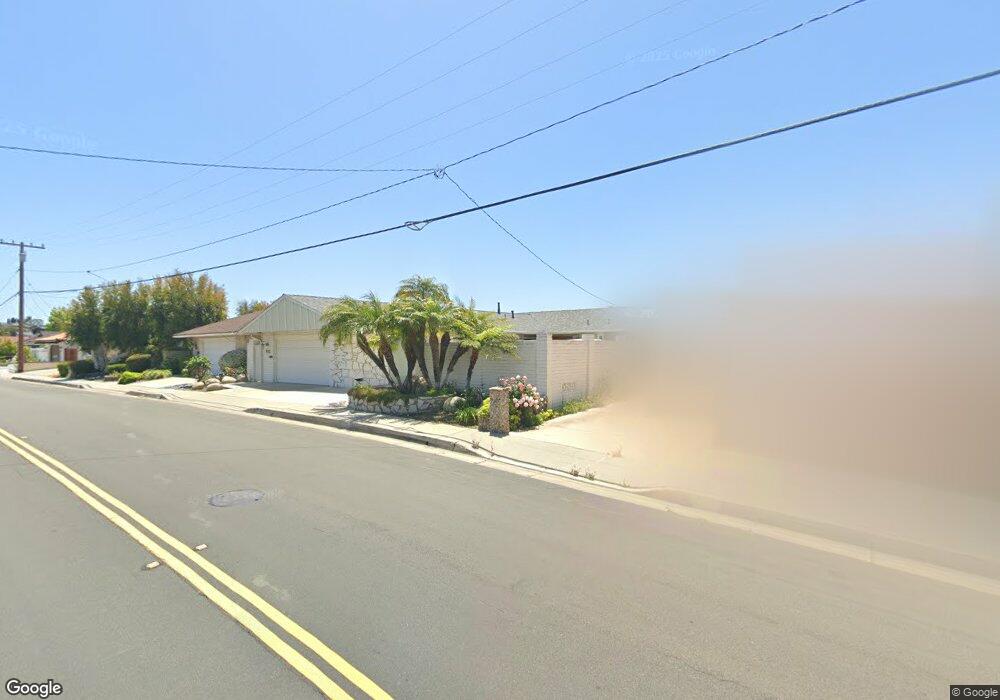
913 Avenida Presidio San Clemente, CA 92672
Central San Clemente NeighborhoodEstimated Value: $1,507,290 - $2,119,000
3
Beds
2
Baths
1,715
Sq Ft
$1,111/Sq Ft
Est. Value
About This Home
This home is located at 913 Avenida Presidio, San Clemente, CA 92672 and is currently estimated at $1,904,573, approximately $1,110 per square foot. 913 Avenida Presidio is a home located in Orange County with nearby schools including Clarence Lobo Elementary School, Shorecliffs Middle School, and San Clemente High School.
Ownership History
Date
Name
Owned For
Owner Type
Purchase Details
Closed on
Jul 27, 2022
Sold by
Klaasen and Deborah
Bought by
Mike And Debbie Klaasen Trust
Current Estimated Value
Purchase Details
Closed on
Dec 8, 2000
Sold by
Klaasen Deborah Sharpe
Bought by
Klaasen Michael and Klaasen Deborah
Purchase Details
Closed on
Jun 30, 2000
Sold by
White James H
Bought by
Klaasen Deborah Sharpe
Purchase Details
Closed on
May 3, 1996
Sold by
White Betty M
Bought by
White Betty M and White James H
Purchase Details
Closed on
Nov 13, 1995
Sold by
White Betty and White Betty M
Bought by
White Betty M
Purchase Details
Closed on
Aug 18, 1995
Sold by
White James H
Bought by
White Betty
Purchase Details
Closed on
Jul 17, 1995
Sold by
Hough Gary T M and Marie Hough J
Bought by
White Betty
Create a Home Valuation Report for This Property
The Home Valuation Report is an in-depth analysis detailing your home's value as well as a comparison with similar homes in the area
Home Values in the Area
Average Home Value in this Area
Purchase History
| Date | Buyer | Sale Price | Title Company |
|---|---|---|---|
| Mike And Debbie Klaasen Trust | -- | None Listed On Document | |
| Klaasen Michael | -- | None Listed On Document | |
| Klaasen Michael | -- | -- | |
| Klaasen Deborah Sharpe | -- | -- | |
| White Betty M | -- | -- | |
| White Betty M | -- | -- | |
| White Betty | -- | Benefit Land Title Company | |
| White Betty | -- | Benefit Land Title Company |
Source: Public Records
Tax History Compared to Growth
Tax History
| Year | Tax Paid | Tax Assessment Tax Assessment Total Assessment is a certain percentage of the fair market value that is determined by local assessors to be the total taxable value of land and additions on the property. | Land | Improvement |
|---|---|---|---|---|
| 2025 | $4,811 | $490,066 | $365,898 | $124,168 |
| 2024 | $4,811 | $480,457 | $358,723 | $121,734 |
| 2023 | $4,708 | $471,037 | $351,689 | $119,348 |
| 2022 | $4,617 | $461,801 | $344,793 | $117,008 |
| 2021 | $4,527 | $452,747 | $338,033 | $114,714 |
| 2020 | $4,481 | $448,105 | $334,567 | $113,538 |
| 2019 | $4,392 | $439,319 | $328,007 | $111,312 |
| 2018 | $4,306 | $430,705 | $321,575 | $109,130 |
| 2017 | $4,221 | $422,260 | $315,269 | $106,991 |
| 2016 | $4,139 | $413,981 | $309,087 | $104,894 |
| 2015 | $4,075 | $407,763 | $304,444 | $103,319 |
| 2014 | $3,995 | $399,776 | $298,480 | $101,296 |
Source: Public Records
Map
Nearby Homes
- 315 Calle Dorado
- 317 Calle Felicidad
- 207 Calle Rica
- 716 Avenida Columbo
- 152 El Levante
- 405 Avenida Salvador
- 27 Burriana
- 149 Avenida de la Paz
- 715 Calle Monserrat
- 151 Avenida Caballeros
- 170 Avenida Presidio
- 609 Via Umbroso
- 143 N La Esperanza
- 815 Calle Dulcinea
- 126 N La Esperanza
- 235 S La Esperanza
- 1062 Calle Del Cerro
- 1062 Calle Del Cerro Unit 1225
- 1062 Calle Del Cerro Unit 1222
- 1052 Calle Del Cerro Unit 705
- 911 Avenida Presidio
- 915 Avenida Presidio
- 909 Avenida Presidio
- 917 Avenida Presidio
- 819 Calle Mendoza
- 914 Avenida Presidio
- 907 Avenida Presidio
- 817 Calle Mendoza
- 905 Avenida Presidio
- 919 Avenida Presidio
- 815 Calle Mendoza
- 916 Avenida Presidio
- 341 Calle Dorado
- 339 Calle Dorado
- 813 Calle Mendoza
- 903 Avenida Presidio
- 343 Calle Dorado
- 918 Avenida Presidio
- 337 Calle Dorado
- 921 Avenida Presidio