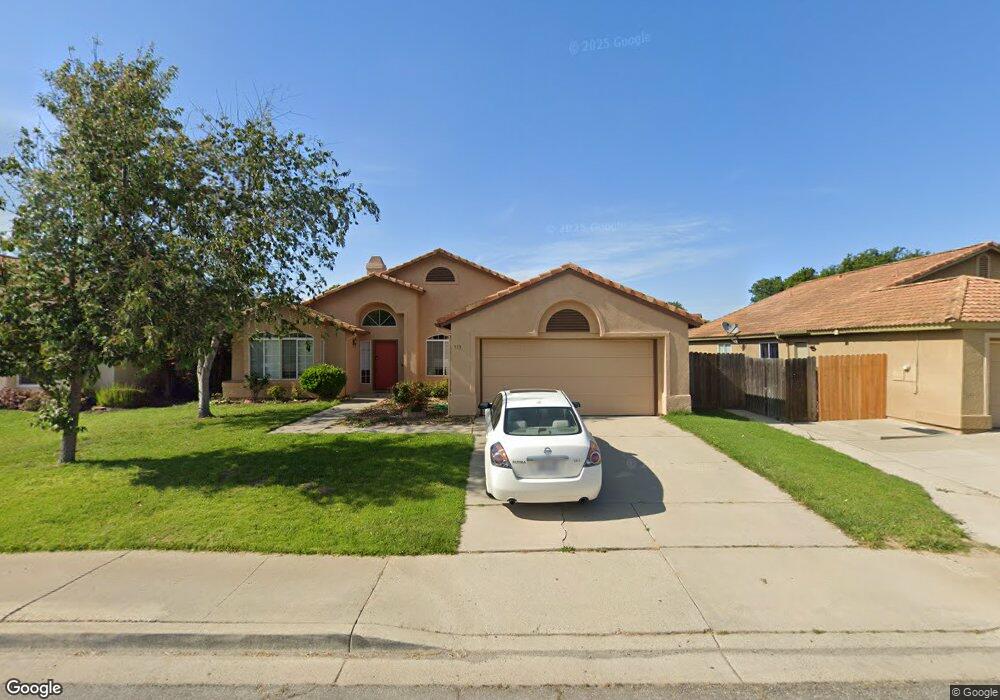
913 Calvert Ave Lompoc, CA 93436
Estimated Value: $676,352 - $718,000
3
Beds
2
Baths
1,980
Sq Ft
$352/Sq Ft
Est. Value
About This Home
This home is located at 913 Calvert Ave, Lompoc, CA 93436 and is currently estimated at $697,088, approximately $352 per square foot. 913 Calvert Ave is a home located in Santa Barbara County with nearby schools including La Honda STEAM Academy, Cabrillo High School, and Olive Grove Charter - Lompoc.
Ownership History
Date
Name
Owned For
Owner Type
Purchase Details
Closed on
Nov 5, 2014
Sold by
Aldama Raul M and Aldama Esther
Bought by
The Raul Aldama & Esther Aldama Living T and Aldama Esther S
Current Estimated Value
Home Financials for this Owner
Home Financials are based on the most recent Mortgage that was taken out on this home.
Original Mortgage
$219,000
Outstanding Balance
$122,892
Interest Rate
4.16%
Mortgage Type
New Conventional
Estimated Equity
$574,196
Purchase Details
Closed on
Nov 22, 2006
Sold by
Aldama Raul M and Aldama Esther S
Bought by
Aldama Raul M and Aldama Esther S
Purchase Details
Closed on
May 18, 2001
Sold by
Pham Khai Quoc and Lam Hang Thi
Bought by
Aldama Raul M and Aldama Esther S
Home Financials for this Owner
Home Financials are based on the most recent Mortgage that was taken out on this home.
Original Mortgage
$198,000
Interest Rate
7.15%
Create a Home Valuation Report for This Property
The Home Valuation Report is an in-depth analysis detailing your home's value as well as a comparison with similar homes in the area
Home Values in the Area
Average Home Value in this Area
Purchase History
| Date | Buyer | Sale Price | Title Company |
|---|---|---|---|
| The Raul Aldama & Esther Aldama Living T | -- | None Available | |
| Aldama Raul M | -- | None Available | |
| Aldama Raul M | -- | None Available | |
| Aldama Raul M | $305,000 | Chicago Title Co |
Source: Public Records
Mortgage History
| Date | Status | Borrower | Loan Amount |
|---|---|---|---|
| Open | Aldama Raul M | $219,000 | |
| Previous Owner | Aldama Raul M | $198,000 |
Source: Public Records
Tax History
| Year | Tax Paid | Tax Assessment Tax Assessment Total Assessment is a certain percentage of the fair market value that is determined by local assessors to be the total taxable value of land and additions on the property. | Land | Improvement |
|---|---|---|---|---|
| 2025 | $4,907 | $450,552 | $140,329 | $310,223 |
| 2023 | $4,907 | $433,059 | $134,881 | $298,178 |
| 2022 | $4,824 | $424,569 | $132,237 | $292,332 |
| 2021 | $4,878 | $416,245 | $129,645 | $286,600 |
| 2020 | $4,826 | $411,978 | $128,316 | $283,662 |
| 2019 | $4,747 | $403,900 | $125,800 | $278,100 |
| 2018 | $4,674 | $395,982 | $123,334 | $272,648 |
| 2017 | $4,589 | $388,218 | $120,916 | $267,302 |
| 2016 | $4,507 | $380,607 | $118,546 | $262,061 |
| 2015 | $4,474 | $374,891 | $116,766 | $258,125 |
| 2014 | $4,411 | $367,548 | $114,479 | $253,069 |
Source: Public Records
Map
Nearby Homes
- 824 Cooper Dr
- 1321 Orchid St
- 1127 Bell Ave
- 1100 N Third St
- 100 California 1
- 1407 N H St
- 701 E Pine Ave Unit 182
- 701 E Pine Ave Unit 176
- 701 E Pine Ave Unit 171
- 701 E Pine Ave Unit 161
- 280 Rinconcito
- 610 E Pine Ave Unit 10
- 610 E Pine Ave Unit 29
- 610 E Pine Ave Unit 62
- 622 N B St
- 1704 E Nectarine Ave
- 321 W North Ave Unit 133
- 601 N Seventh St
- 2655 Adobe Falls Rd
- 505 N 1st St
- 909 Calvert Ave
- 917 Calvert Ave
- 908 Cagney Way
- 912 Cagney Way
- 905 Calvert Ave
- 921 Calvert Ave
- 904 Cagney Way
- 912 Calvert Ave
- 916 Calvert Ave
- 908 Calvert Ave
- 901 Calvert Ave
- 900 Cagney Way
- 925 Calvert Ave
- 920 Calvert Ave
- 1421 Riverside Dr
- 904 Calvert Ave
- 1425 Riverside Dr
- 824 Cagney Way
- 924 Calvert Ave
Your Personal Tour Guide
Ask me questions while you tour the home.