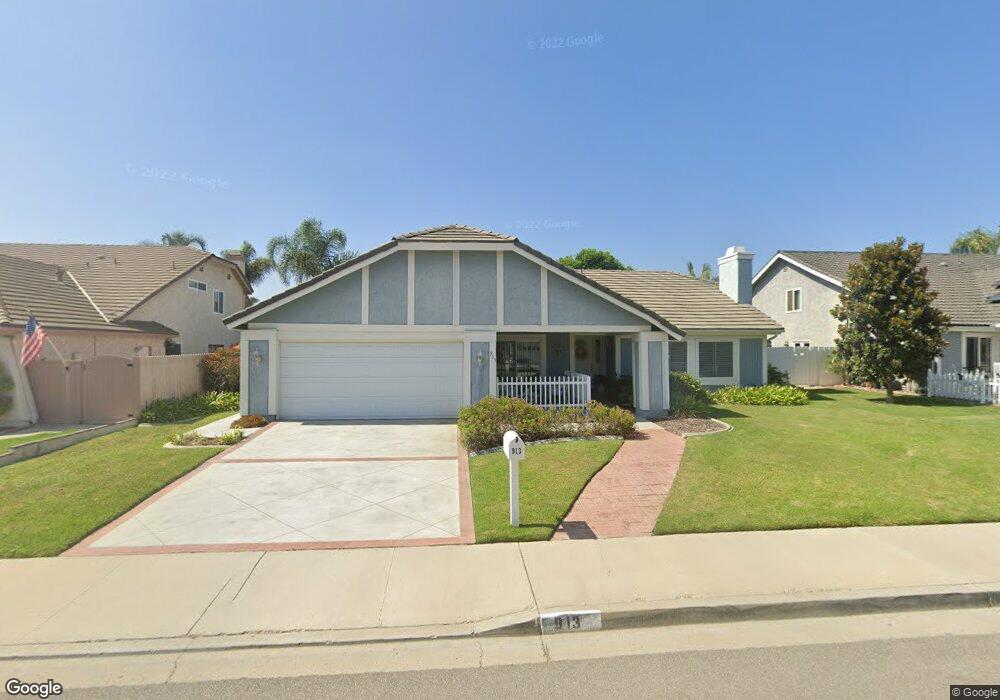
913 Comanche Ct Camarillo, CA 93010
Estimated Value: $872,768 - $949,000
3
Beds
2
Baths
1,772
Sq Ft
$523/Sq Ft
Est. Value
About This Home
This home is located at 913 Comanche Ct, Camarillo, CA 93010 and is currently estimated at $925,942, approximately $522 per square foot. 913 Comanche Ct is a home located in Ventura County with nearby schools including Dos Caminos Elementary School, Monte Vista Middle School, and Adolfo Camarillo High School.
Ownership History
Date
Name
Owned For
Owner Type
Purchase Details
Closed on
Sep 21, 2018
Sold by
Hartmann Raymond G and Hartmann Nancy J
Bought by
Hartmann Raymond G and Hartmann Nancy J
Current Estimated Value
Purchase Details
Closed on
Dec 3, 2013
Sold by
The Jones Trust
Bought by
Hartmann Raymond G and Hartmann Nancy J
Home Financials for this Owner
Home Financials are based on the most recent Mortgage that was taken out on this home.
Original Mortgage
$778,500
Outstanding Balance
$587,564
Interest Rate
4.46%
Mortgage Type
Reverse Mortgage Home Equity Conversion Mortgage
Estimated Equity
$338,378
Purchase Details
Closed on
Feb 22, 1996
Sold by
Jones Robert and Jones Eva J
Bought by
Jones Robert C and Jones Eva J
Purchase Details
Closed on
Mar 28, 1995
Sold by
Hill Donald E and Hill Sylvia J
Bought by
Jones Robert and Jones Eva J
Create a Home Valuation Report for This Property
The Home Valuation Report is an in-depth analysis detailing your home's value as well as a comparison with similar homes in the area
Home Values in the Area
Average Home Value in this Area
Purchase History
| Date | Buyer | Sale Price | Title Company |
|---|---|---|---|
| Hartmann Raymond G | -- | None Available | |
| Hartmann Raymond G | $519,000 | Chicago Title Company | |
| Jones Robert C | -- | -- | |
| Jones Robert | $218,000 | Lincoln Title Co |
Source: Public Records
Mortgage History
| Date | Status | Borrower | Loan Amount |
|---|---|---|---|
| Open | Hartmann Raymond G | $778,500 |
Source: Public Records
Tax History
| Year | Tax Paid | Tax Assessment Tax Assessment Total Assessment is a certain percentage of the fair market value that is determined by local assessors to be the total taxable value of land and additions on the property. | Land | Improvement |
|---|---|---|---|---|
| 2025 | $3,688 | $338,070 | $118,315 | $219,755 |
| 2024 | $3,688 | $331,442 | $115,995 | $215,447 |
| 2023 | $3,555 | $324,944 | $113,721 | $211,223 |
| 2022 | $3,543 | $318,573 | $111,491 | $207,082 |
| 2021 | $3,415 | $312,327 | $109,305 | $203,022 |
| 2020 | $3,402 | $309,127 | $108,185 | $200,942 |
| 2019 | $3,385 | $303,066 | $106,064 | $197,002 |
| 2018 | $3,321 | $297,125 | $103,985 | $193,140 |
| 2017 | $3,126 | $291,300 | $101,947 | $189,353 |
| 2016 | $3,051 | $285,590 | $99,949 | $185,641 |
| 2015 | $3,018 | $281,302 | $98,449 | $182,853 |
| 2014 | $1,048 | $97,170 | $18,109 | $79,061 |
Source: Public Records
Map
Nearby Homes
- 1075 Seybolt Ave
- 1623 Regent St
- 1487 Nordman Dr
- 1654 Edgewater Ln
- 813 N Calle Circulo
- 1387 Lantana St
- 1682 Darnell Ct
- 560 Chapala Dr
- 1574 Habra Ct
- 1150 Ventura Blvd Unit 77
- 1150 Ventura Blvd Unit 109
- 1150 Ventura Blvd Unit SPC 125
- 1150 Ventura Blvd Unit 110
- 1150 Ventura Blvd Unit 62
- 1767 Dunnigan St
- 49 Brea Ct
- 425 Baja Ct
- 157 Lantana St
- 2854 Via Monte Mar
- 239 Cartagena St
- 915 Comanche Ct
- 911 Comanche Ct
- 750 Valle Lindo Dr
- 784 Valle Lindo Dr
- 716 Valle Lindo Dr
- 917 Comanche Ct
- 914 Comanche Ct
- 912 Comanche Ct
- 916 Comanche Ct
- 910 Comanche Ct
- 904 Comanche Ct
- 902 Comanche Ct
- 918 Comanche Ct
- 906 Comanche Ct
- 900 Comanche Ct
- 908 Comanche Ct
- 751 Valle Lindo Dr
- 717 Valle Lindo Dr
- 785 Valle Lindo Dr
- 924 Comanche Ct
Your Personal Tour Guide
Ask me questions while you tour the home.