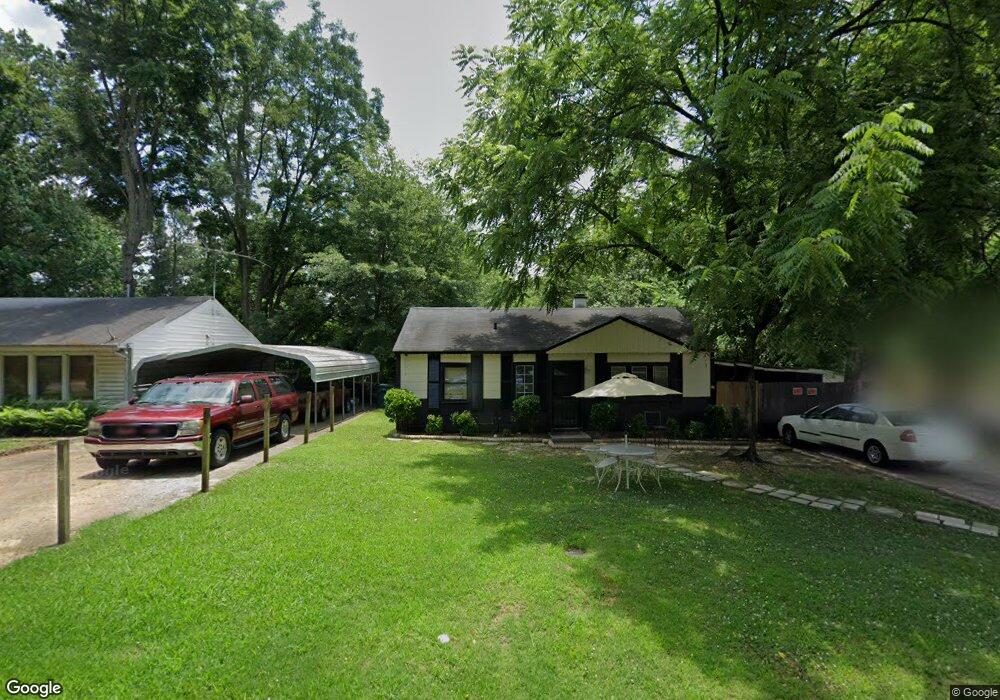
913 Floyd Ave Memphis, TN 38127
Frayser NeighborhoodEstimated Value: $58,000 - $95,000
3
Beds
1
Bath
875
Sq Ft
$89/Sq Ft
Est. Value
About This Home
This home is located at 913 Floyd Ave, Memphis, TN 38127 and is currently estimated at $77,818, approximately $88 per square foot. 913 Floyd Ave is a home located in Shelby County with nearby schools including Westside Elementary School, Trezevant High School, and Compass Community School Frayser Campus.
Ownership History
Date
Name
Owned For
Owner Type
Purchase Details
Closed on
Mar 5, 2010
Sold by
Cooper Properties Llc
Bought by
Carrillo Miguel and Alcala Maria Del R
Current Estimated Value
Home Financials for this Owner
Home Financials are based on the most recent Mortgage that was taken out on this home.
Original Mortgage
$27,500
Interest Rate
4.97%
Mortgage Type
Seller Take Back
Purchase Details
Closed on
Feb 8, 2010
Sold by
Mclean Properties Llc
Bought by
Cooper Properties Llc
Home Financials for this Owner
Home Financials are based on the most recent Mortgage that was taken out on this home.
Original Mortgage
$27,500
Interest Rate
4.97%
Mortgage Type
Seller Take Back
Purchase Details
Closed on
Oct 20, 2003
Sold by
Mclean Charles E and Mclean Mary Ann
Bought by
Mclean Properties Llc
Purchase Details
Closed on
Sep 16, 2003
Sold by
Midsouth Foreclosure Llc
Bought by
Mclean Charles E and Mclean Mary Ann
Purchase Details
Closed on
Jul 19, 2002
Sold by
Branch Hal A
Bought by
Hud
Purchase Details
Closed on
Dec 15, 1998
Sold by
Branch Mary J
Bought by
Branch Hal A
Purchase Details
Closed on
Mar 31, 1997
Sold by
Crenshaw Earlene B
Bought by
Branch Hal A
Home Financials for this Owner
Home Financials are based on the most recent Mortgage that was taken out on this home.
Original Mortgage
$42,382
Interest Rate
7.86%
Mortgage Type
FHA
Create a Home Valuation Report for This Property
The Home Valuation Report is an in-depth analysis detailing your home's value as well as a comparison with similar homes in the area
Home Values in the Area
Average Home Value in this Area
Purchase History
| Date | Buyer | Sale Price | Title Company |
|---|---|---|---|
| Carrillo Miguel | $37,500 | None Available | |
| Cooper Properties Llc | $6,500 | None Available | |
| Mclean Properties Llc | -- | -- | |
| Mclean Charles E | $22,500 | -- | |
| Hud | $43,300 | -- | |
| Branch Hal A | -- | -- | |
| Branch Hal A | $42,000 | -- |
Source: Public Records
Mortgage History
| Date | Status | Borrower | Loan Amount |
|---|---|---|---|
| Closed | Carrillo Miguel | $27,500 | |
| Previous Owner | Branch Hal A | $42,382 |
Source: Public Records
Tax History Compared to Growth
Tax History
| Year | Tax Paid | Tax Assessment Tax Assessment Total Assessment is a certain percentage of the fair market value that is determined by local assessors to be the total taxable value of land and additions on the property. | Land | Improvement |
|---|---|---|---|---|
| 2025 | $303 | $13,350 | $1,625 | $11,725 |
| 2024 | $303 | $8,925 | $1,275 | $7,650 |
| 2023 | $544 | $8,925 | $1,275 | $7,650 |
| 2022 | $544 | $8,925 | $1,275 | $7,650 |
| 2021 | $550 | $8,925 | $1,275 | $7,650 |
| 2020 | $435 | $6,000 | $1,275 | $4,725 |
| 2019 | $435 | $6,000 | $1,275 | $4,725 |
| 2018 | $435 | $6,000 | $1,275 | $4,725 |
| 2017 | $247 | $6,000 | $1,275 | $4,725 |
| 2016 | $312 | $7,150 | $0 | $0 |
| 2014 | $312 | $7,150 | $0 | $0 |
Source: Public Records
Map
Nearby Homes