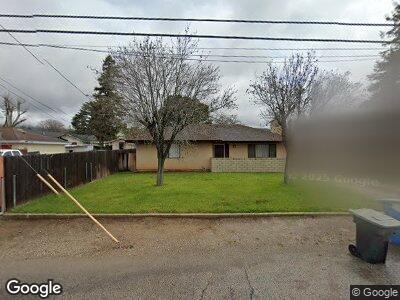
913 Fremont St Calimesa, CA 92320
Estimated Value: $504,971 - $523,000
3
Beds
2
Baths
1,262
Sq Ft
$406/Sq Ft
Est. Value
About This Home
This home is located at 913 Fremont St, Calimesa, CA 92320 and is currently estimated at $511,743, approximately $405 per square foot. 913 Fremont St is a home located in Riverside County with nearby schools including Wildwood Elementary School, Mesa View Middle School, and Yucaipa High School.
Ownership History
Date
Name
Owned For
Owner Type
Purchase Details
Closed on
Oct 24, 2011
Sold by
Estate Of Calogero Joseph Messina
Bought by
Gross Christopher J
Current Estimated Value
Home Financials for this Owner
Home Financials are based on the most recent Mortgage that was taken out on this home.
Original Mortgage
$151,070
Interest Rate
4.01%
Mortgage Type
FHA
Purchase Details
Closed on
Mar 17, 1998
Sold by
Messina Margaret L
Bought by
Messina Calogero J
Home Financials for this Owner
Home Financials are based on the most recent Mortgage that was taken out on this home.
Original Mortgage
$43,575
Interest Rate
7.02%
Mortgage Type
Unknown
Create a Home Valuation Report for This Property
The Home Valuation Report is an in-depth analysis detailing your home's value as well as a comparison with similar homes in the area
Home Values in the Area
Average Home Value in this Area
Purchase History
| Date | Buyer | Sale Price | Title Company |
|---|---|---|---|
| Gross Christopher J | $155,000 | Nations Title Company |
Source: Public Records
Mortgage History
| Date | Status | Borrower | Loan Amount |
|---|---|---|---|
| Open | Gross Christopher J | $155,000 | |
| Closed | Gross Christopher J | $50,000 | |
| Closed | Gross Christopher J | $153,900 | |
| Closed | Gross Christopher J | $151,070 | |
| Previous Owner | Messina Calogero J | $43,575 |
Source: Public Records
Tax History Compared to Growth
Tax History
| Year | Tax Paid | Tax Assessment Tax Assessment Total Assessment is a certain percentage of the fair market value that is determined by local assessors to be the total taxable value of land and additions on the property. | Land | Improvement |
|---|---|---|---|---|
| 2023 | $2,254 | $187,118 | $42,250 | $144,868 |
| 2022 | $2,178 | $183,450 | $41,422 | $142,028 |
| 2021 | $2,149 | $179,854 | $40,610 | $139,244 |
| 2020 | $2,146 | $178,011 | $40,194 | $137,817 |
| 2019 | $2,053 | $174,521 | $39,406 | $135,115 |
| 2018 | $2,033 | $171,100 | $38,634 | $132,466 |
| 2017 | $1,987 | $167,746 | $37,877 | $129,869 |
| 2016 | $1,946 | $164,458 | $37,135 | $127,323 |
| 2015 | $1,924 | $161,989 | $36,578 | $125,411 |
| 2014 | $1,884 | $158,817 | $35,862 | $122,955 |
Source: Public Records
Map
Nearby Homes
- 375 E County Line Rd
- 477 E County Line Rd
- 35616 Oak Creek Dr
- 35854 Rebecca Rd
- 0 Holmes St
- 342 E Avenue L
- 35935 Leah Ln
- 13487 Fremont St
- 35685 Avenue H
- 13666 Cottonwood Trail
- 35339 San Pablo Dr
- 217 Syllmar Cir
- 13664 Bryant St
- 35280 Santa Maria St
- 916 Stearns St
- 35230 San Carlos St
- 13607 Chaparral Trail
- 36116 Sharon Way
- 35408 Avenue H
- 8725 Arabian Way
- 913 Fremont St
- 919 Fremont St
- 411 E County Line Rd
- 907 Fremont St
- 417 E County Line Rd
- 925 Fremont St
- 912 Grant St
- 423 E County Line Rd
- 916 Grant St
- 914 Fremont St
- 920 Fremont St
- 397 E County Line Rd
- 906 Grant St
- 931 Fremont St
- 920 Grant St
- 928 Fremont St
- 35728 County Line Rd
- 35744 County Line Rd
- 937 Fremont St
- 926 Grant St