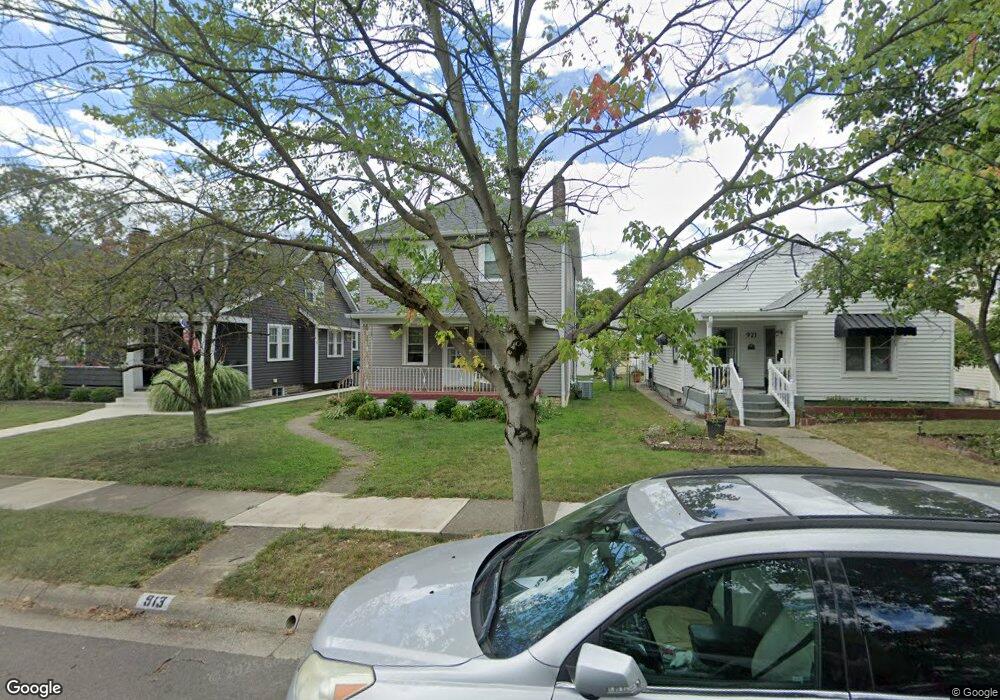
913 Mcclain Rd Columbus, OH 43212
Estimated Value: $474,000 - $597,000
3
Beds
2
Baths
1,230
Sq Ft
$438/Sq Ft
Est. Value
About This Home
This home is located at 913 Mcclain Rd, Columbus, OH 43212 and is currently estimated at $538,906, approximately $438 per square foot. 913 Mcclain Rd is a home located in Franklin County with nearby schools including Robert Louis Stevenson Elementary School, Larson Middle School, and Grandview Heights High School.
Ownership History
Date
Name
Owned For
Owner Type
Purchase Details
Closed on
Oct 12, 2021
Sold by
Leary Shannon and Connell Shannon Lavie
Bought by
Connell Shannon Lavie and Connell Michael Riley
Current Estimated Value
Home Financials for this Owner
Home Financials are based on the most recent Mortgage that was taken out on this home.
Original Mortgage
$492,000
Outstanding Balance
$444,746
Interest Rate
2.8%
Mortgage Type
Construction
Estimated Equity
$94,160
Purchase Details
Closed on
May 23, 2014
Sold by
1141 First Llc
Bought by
Leary Shannon
Home Financials for this Owner
Home Financials are based on the most recent Mortgage that was taken out on this home.
Original Mortgage
$228,000
Interest Rate
4.28%
Mortgage Type
New Conventional
Purchase Details
Closed on
Oct 20, 2009
Sold by
Wolf James J and Wolf Donna J
Bought by
1141 First Llc
Purchase Details
Closed on
Apr 30, 1998
Sold by
Pope Michael P
Bought by
Wolf James J and Wolf Donna J
Purchase Details
Closed on
Mar 30, 1994
Create a Home Valuation Report for This Property
The Home Valuation Report is an in-depth analysis detailing your home's value as well as a comparison with similar homes in the area
Home Values in the Area
Average Home Value in this Area
Purchase History
| Date | Buyer | Sale Price | Title Company |
|---|---|---|---|
| Connell Shannon Lavie | -- | Transcounty Title Agency Llc | |
| Leary Shannon | $240,000 | Atlas Title | |
| 1141 First Llc | -- | Attorney | |
| Wolf James J | $124,000 | Chicago Title | |
| -- | -- | -- |
Source: Public Records
Mortgage History
| Date | Status | Borrower | Loan Amount |
|---|---|---|---|
| Open | Connell Shannon Lavie | $492,000 | |
| Closed | Leary Shannon | $228,000 |
Source: Public Records
Tax History
| Year | Tax Paid | Tax Assessment Tax Assessment Total Assessment is a certain percentage of the fair market value that is determined by local assessors to be the total taxable value of land and additions on the property. | Land | Improvement |
|---|---|---|---|---|
| 2025 | $8,294 | $142,210 | $57,650 | $84,560 |
| 2024 | $8,294 | $142,210 | $57,650 | $84,560 |
| 2023 | $7,266 | $142,205 | $57,645 | $84,560 |
| 2022 | $8,020 | $133,670 | $36,650 | $97,020 |
| 2021 | $6,077 | $108,190 | $36,650 | $71,540 |
| 2020 | $6,052 | $108,190 | $36,650 | $71,540 |
| 2019 | $5,801 | $91,780 | $36,650 | $55,130 |
| 2018 | $5,006 | $91,780 | $36,650 | $55,130 |
| 2017 | $5,409 | $91,780 | $36,650 | $55,130 |
| 2016 | $4,236 | $61,540 | $24,330 | $37,210 |
| 2015 | $4,237 | $61,540 | $24,330 | $37,210 |
| 2014 | $4,361 | $61,540 | $24,330 | $37,210 |
| 2013 | $1,920 | $55,930 | $22,120 | $33,810 |
Source: Public Records
Map
Nearby Homes
- 945 Quay Ave Unit 945E
- 1081 W 3rd Ave
- 967-973 Burr Ave
- 827 Northwest Blvd Unit 827-833
- 912 Northwest Blvd Unit 910
- 922 Northwest Blvd
- 789 Northwest Blvd Unit G
- 1126 Northwest Blvd
- 951 Hudson Crossing
- 862 Pullman Way
- 952 Pullman Place Unit 27
- 950 Pullman Place Unit 27
- 942 W 1st Ave
- 1416 Inglis Ave
- 1116 Edgehill Rd
- 1242 Oxley Rd
- 1083 W 3rd Ave
- 1095 W 3rd Ave
- 1093 W 3rd Ave
- 1000 Urlin Ave Unit 211
- 909 Mcclain Rd
- 921 Mcclain Rd
- 903 Mcclain Rd
- 923 Mcclain Rd
- 897 Mcclain Rd
- 929 Mcclain Rd
- 914 Palmer Rd Unit 916
- 893 Mcclain Rd
- 933 Mcclain Rd
- 930 Palmer Rd
- 922 Palmer Rd
- 910 Palmer Rd Unit 912
- 910 Palmer Rd Unit 910-912
- 926 Palmer Rd
- 912 Mcclain Rd
- 918 Mcclain Rd
- 908 Mcclain Rd
- 936 Palmer Rd
- 900 Mcclain Rd
- 889 Mcclain Rd
Your Personal Tour Guide
Ask me questions while you tour the home.