913 N R St Lompoc, CA 93436
Lompoc AreaEstimated Value: $603,387 - $632,000
About This Home
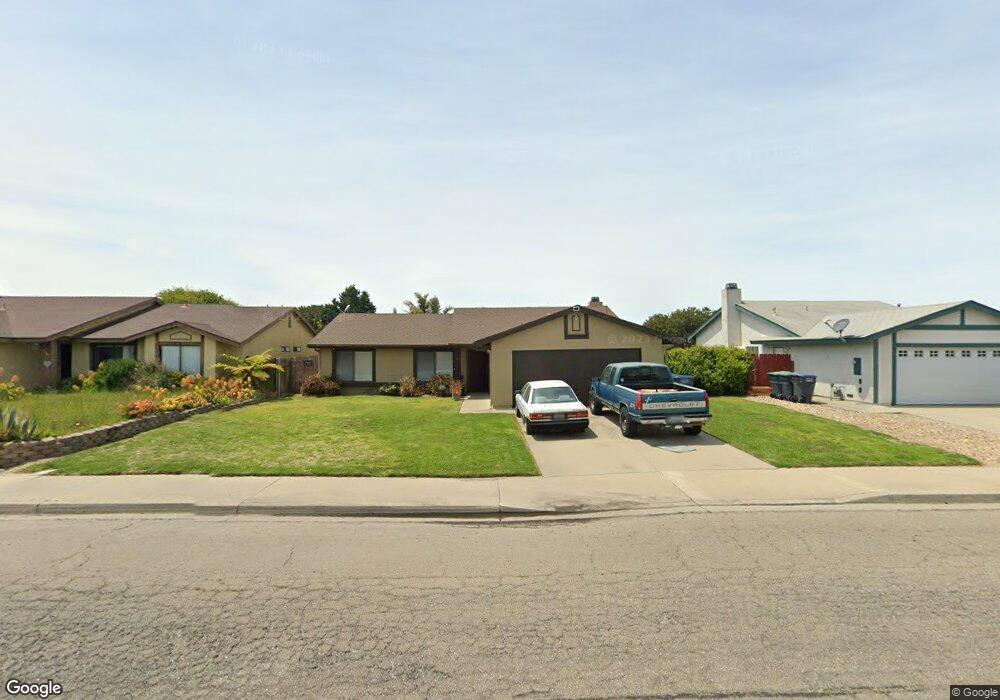
This home is located at 913 N R St, Lompoc, CA 93436 and is currently estimated at $620,097, approximately $434 per square foot. 913 N R St is a home located in Santa Barbara County with nearby schools including La Canada Elementary School, Lompoc Valley Middle School, and Lompoc High School.
Ownership History
We collect this data history from publicly available records. To have your information removed, we recommend requesting removal directly through your county’s website.
Purchase Details
Purchase Details
Purchase Details
Purchase Details
Home Values in the Area
Average Home Value in this Area
Purchase History
We collect this data history from publicly available records. To have your information removed, we recommend requesting removal directly through your county’s website.
| Date | Buyer | Sale Price | Title Company |
|---|---|---|---|
| $138,000 | Chicago Title Co | ||
| -- | Stewart Title | ||
| $134,500 | Stewart Title | ||
| $130,000 | American Title Ins Co |
Mortgage History
We collect this data history from publicly available records. To have your information removed, we recommend requesting removal directly through your county’s website.
| Date | Status | Borrower | Loan Amount |
|---|---|---|---|
| Open | $317,000 | ||
| Closed | $284,000 | ||
| Closed | $60,000 | ||
| Closed | $315,000 | ||
| Closed | $244,000 | ||
| Closed | $206,250 | ||
| Closed | $38,454 | ||
| Closed | $143,322 |
Tax History
We collect this data history from publicly available records. To have your information removed, we recommend requesting removal directly through your county’s website.
| Year | Tax Paid | Tax Assessment Tax Assessment Total Assessment is a certain percentage of the fair market value that is determined by local assessors to be the total taxable value of land and additions on the property. | Land | Improvement |
|---|---|---|---|---|
| 2026 | $2,615 | $229,230 | $83,048 | $146,182 |
| 2025 | $2,474 | $224,736 | $81,420 | $143,316 |
| 2023 | $2,474 | $216,010 | $78,259 | $137,751 |
| 2022 | $2,431 | $211,775 | $76,725 | $135,050 |
| 2021 | $2,457 | $207,623 | $75,221 | $132,402 |
| 2020 | $2,431 | $205,495 | $74,450 | $131,045 |
| 2019 | $2,390 | $201,467 | $72,991 | $128,476 |
| 2018 | $2,353 | $197,517 | $71,560 | $125,957 |
| 2017 | $2,310 | $193,645 | $70,157 | $123,488 |
| 2016 | $2,269 | $189,849 | $68,782 | $121,067 |
| 2015 | $2,252 | $186,998 | $67,749 | $119,249 |
| 2014 | -- | $183,336 | $66,422 | $116,914 |
Map
- 1116 W Cherry Ave
- 1513 W Lemon Ave
- 904 W College Ave
- 1213 Iris Ct
- 516 N U St
- 1381 Village Meadows Dr
- 1617 Alexander Ave
- 1305 Plum Ave
- 1308 Jason Dr
- 1425 Michael Ct
- 1320 Viola Way
- 321 W North Ave Unit 177
- 1249 Westbrook Dr
- 405 N V St
- 1340 Jason Dr
- 526 N L St
- 1114 Point Sal Loop
- 713 Northbrook Dr
- 1317 N V St Unit 97
- 521 Brookside Dr
Ask me questions while you tour the home.