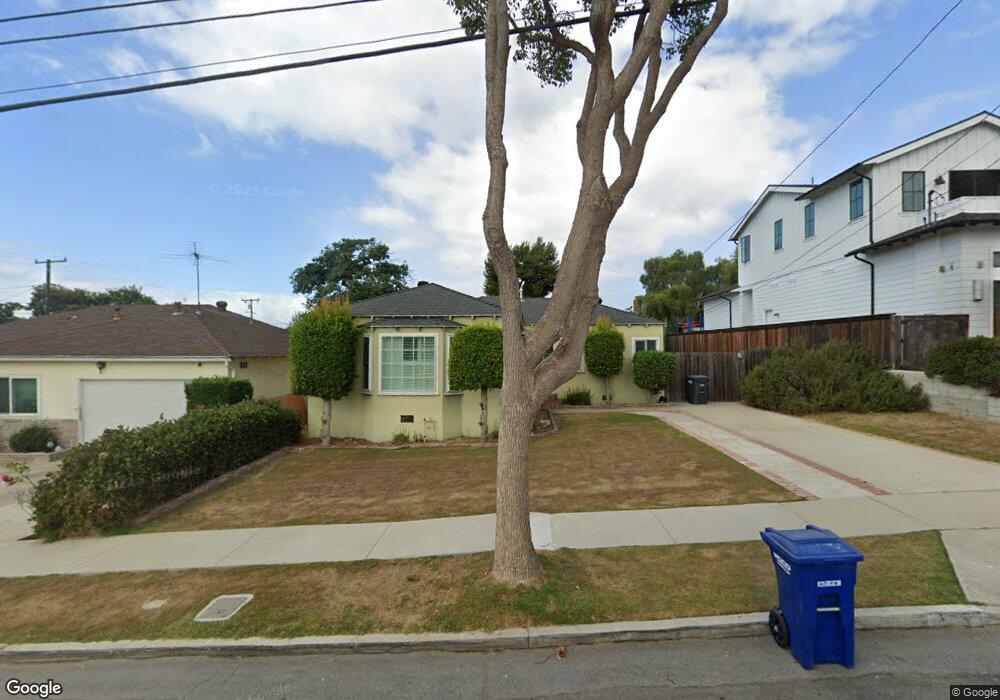
913 Sheldon St El Segundo, CA 90245
Estimated Value: $1,645,534 - $1,770,000
3
Beds
2
Baths
1,467
Sq Ft
$1,178/Sq Ft
Est. Value
About This Home
This home is located at 913 Sheldon St, El Segundo, CA 90245 and is currently estimated at $1,727,884, approximately $1,177 per square foot. 913 Sheldon St is a home located in Los Angeles County with nearby schools including Center Street Elementary, El Segundo Middle School, and El Segundo High School.
Ownership History
Date
Name
Owned For
Owner Type
Purchase Details
Closed on
May 13, 2003
Sold by
Bimber Eric C
Bought by
Bimber Eric C
Current Estimated Value
Home Financials for this Owner
Home Financials are based on the most recent Mortgage that was taken out on this home.
Original Mortgage
$322,700
Interest Rate
5.71%
Purchase Details
Closed on
May 6, 2003
Sold by
Bimber Colleen E Condon
Bought by
Bimber Eric C
Home Financials for this Owner
Home Financials are based on the most recent Mortgage that was taken out on this home.
Original Mortgage
$322,700
Interest Rate
5.71%
Create a Home Valuation Report for This Property
The Home Valuation Report is an in-depth analysis detailing your home's value as well as a comparison with similar homes in the area
Home Values in the Area
Average Home Value in this Area
Purchase History
| Date | Buyer | Sale Price | Title Company |
|---|---|---|---|
| Bimber Eric C | -- | -- | |
| Bimber Eric C | -- | Investors Title Company |
Source: Public Records
Mortgage History
| Date | Status | Borrower | Loan Amount |
|---|---|---|---|
| Closed | Bimber Eric C | $322,700 |
Source: Public Records
Tax History
| Year | Tax Paid | Tax Assessment Tax Assessment Total Assessment is a certain percentage of the fair market value that is determined by local assessors to be the total taxable value of land and additions on the property. | Land | Improvement |
|---|---|---|---|---|
| 2025 | $4,920 | $440,028 | $383,749 | $56,279 |
| 2024 | $4,920 | $431,401 | $376,225 | $55,176 |
| 2023 | $4,795 | $422,944 | $368,849 | $54,095 |
| 2022 | $4,844 | $414,652 | $361,617 | $53,035 |
| 2021 | $4,774 | $406,523 | $354,527 | $51,996 |
| 2019 | $4,612 | $394,466 | $344,012 | $50,454 |
| 2018 | $4,297 | $386,732 | $337,267 | $49,465 |
| 2016 | $4,162 | $371,717 | $324,171 | $47,546 |
| 2015 | $4,110 | $366,134 | $319,302 | $46,832 |
| 2014 | $4,029 | $358,963 | $313,048 | $45,915 |
Source: Public Records
Map
Nearby Homes
- 529 E Walnut Ave
- 426 E Imperial Ave
- 519 E Sycamore Ave
- 572 E Imperial Ave
- 329 E Maple Ave
- 212 E Imperial Ave Unit A
- 212 E Imperial Ave Unit E
- 121 E Walnut Ave
- 924 Main St
- 935 Main St Unit 303
- 860 Bungalow Dr
- 745 Main St
- 219 W Acacia Ave
- 1112 E Imperial Ave
- 1116 E Imperial Ave
- 529 Sierra Place
- 955 Virginia St
- 211 E Pine Ave
- 500 E Imperial Ave
- 432 Lomita St
- 925 Sheldon St
- 909 Sheldon St
- 917 Sheldon St
- 419 E Walnut Ave
- 425 E Walnut Ave
- 914 Cypress St
- 922 Cypress St
- 407 E Walnut Ave
- 929 Sheldon St
- 908 Sheldon St
- 401 E Walnut Ave
- 912 Sheldon St
- 916 Sheldon St
- 904 Sheldon St
- 930 Cypress St
- 922 Sheldon St
- 926 Sheldon St
- 861 Sheldon St
- 933 Sheldon St
- 509 E Walnut Ave
Your Personal Tour Guide
Ask me questions while you tour the home.