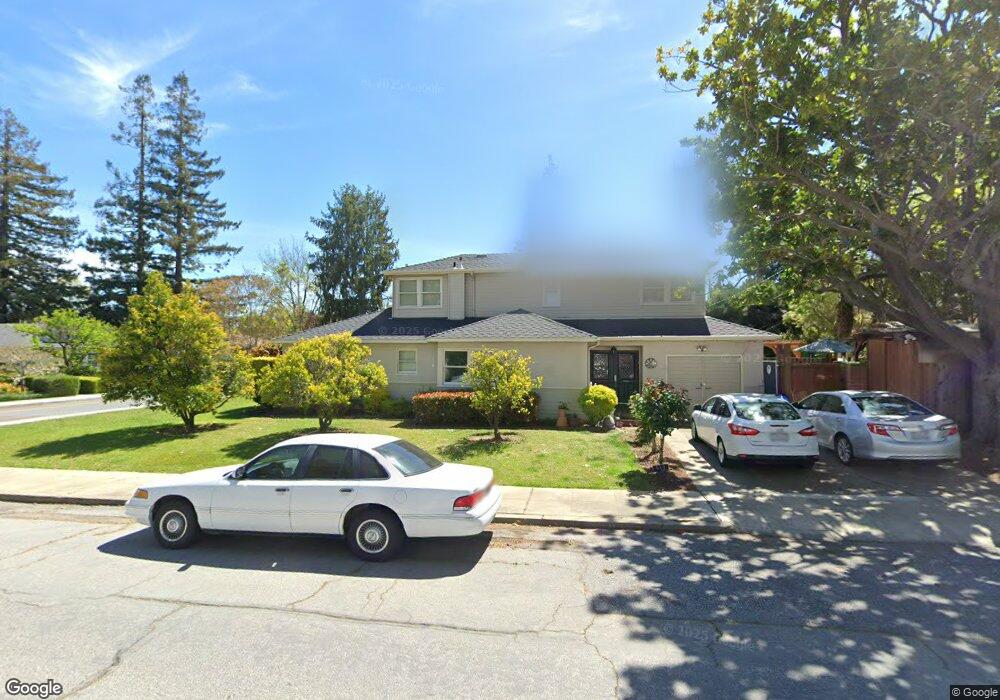
913 View St Mountain View, CA 94041
Estimated Value: $1,979,000 - $3,162,000
4
Beds
2
Baths
1,214
Sq Ft
$2,036/Sq Ft
Est. Value
About This Home
This home is located at 913 View St, Mountain View, CA 94041 and is currently estimated at $2,471,623, approximately $2,035 per square foot. 913 View St is a home located in Santa Clara County with nearby schools including Edith Landels Elementary School, Isaac Newton Graham Middle School, and Mountain View High School.
Ownership History
Date
Name
Owned For
Owner Type
Purchase Details
Closed on
Dec 17, 2010
Sold by
Collins Richard J and Broderick Collins Catherine
Bought by
Collins Richard J and Broderick Collins Catherine
Current Estimated Value
Purchase Details
Closed on
May 20, 2003
Sold by
Collins Richard J and Collins Catherine B
Bought by
Collins Richard J and Collins Catherine B
Home Financials for this Owner
Home Financials are based on the most recent Mortgage that was taken out on this home.
Original Mortgage
$280,000
Outstanding Balance
$121,339
Interest Rate
5.75%
Mortgage Type
Purchase Money Mortgage
Estimated Equity
$2,350,284
Purchase Details
Closed on
Mar 24, 1996
Sold by
Kurth Louise
Bought by
Collins Richard J and Collins Catherine B
Home Financials for this Owner
Home Financials are based on the most recent Mortgage that was taken out on this home.
Original Mortgage
$270,750
Interest Rate
7.5%
Create a Home Valuation Report for This Property
The Home Valuation Report is an in-depth analysis detailing your home's value as well as a comparison with similar homes in the area
Home Values in the Area
Average Home Value in this Area
Purchase History
| Date | Buyer | Sale Price | Title Company |
|---|---|---|---|
| Collins Richard J | -- | None Available | |
| Collins Richard J | -- | Alliance Title Company | |
| Collins Richard J | $285,000 | First American Title Guarant |
Source: Public Records
Mortgage History
| Date | Status | Borrower | Loan Amount |
|---|---|---|---|
| Open | Collins Richard J | $280,000 | |
| Closed | Collins Richard J | $270,750 |
Source: Public Records
Tax History
| Year | Tax Paid | Tax Assessment Tax Assessment Total Assessment is a certain percentage of the fair market value that is determined by local assessors to be the total taxable value of land and additions on the property. | Land | Improvement |
|---|---|---|---|---|
| 2025 | $6,778 | $575,922 | $315,627 | $260,295 |
| 2024 | $6,778 | $564,631 | $309,439 | $255,192 |
| 2023 | $6,708 | $553,561 | $303,372 | $250,189 |
| 2022 | $6,686 | $542,708 | $297,424 | $245,284 |
| 2021 | $6,524 | $532,068 | $291,593 | $240,475 |
| 2020 | $6,530 | $526,614 | $288,604 | $238,010 |
| 2019 | $6,261 | $516,290 | $282,946 | $233,344 |
| 2018 | $6,201 | $506,168 | $277,399 | $228,769 |
| 2017 | $5,949 | $496,244 | $271,960 | $224,284 |
| 2016 | $5,741 | $486,515 | $266,628 | $219,887 |
| 2015 | $5,577 | $479,208 | $262,623 | $216,585 |
| 2014 | $5,527 | $469,822 | $257,479 | $212,343 |
Source: Public Records
Map
Nearby Homes
- 100 W El Camino Real Unit 40
- 813 Montgomery St
- 111 Nancy Ct
- 260 Velarde St
- 948 Rincon St
- 943 Trophy Dr
- 956 Trophy Dr
- 231 Hope St
- 225 Hope St
- 229 Hope St
- 221 Hope St
- 1515 Miramonte Ave
- 1451 Tyler Park Way
- 108 Bryant St Unit 28
- 108 Bryant St Unit 30
- 120 Orchard Ave
- 191 E El Camino Real Unit 138
- 191 E El Camino Real Unit 260
- 191 E El Camino Real Unit 146
- 284 Elmwood St
- 575 Fairmont Ave
- 561 Fairmont Ave
- 611 Fairmont Ave
- 893 View St
- 574 Fairmont Ave
- 600 W El Camino Real
- 619 Fairmont Ave Unit 2
- 619 Fairmont Ave
- 560 Fairmont Ave
- 540 Fairmont Ave
- 525 Fairmont Ave
- 631 Fairmont Ave Unit C
- 631 Fairmont Ave
- 631 Fairmont Ave Unit A
- 631 Fairmont Ave Unit B
- 631 Fairmont Ave
- 622 Fairmont Ave
- 522 Fairmont Ave
- 827 View St
- 575 Yosemite Ave
Your Personal Tour Guide
Ask me questions while you tour the home.