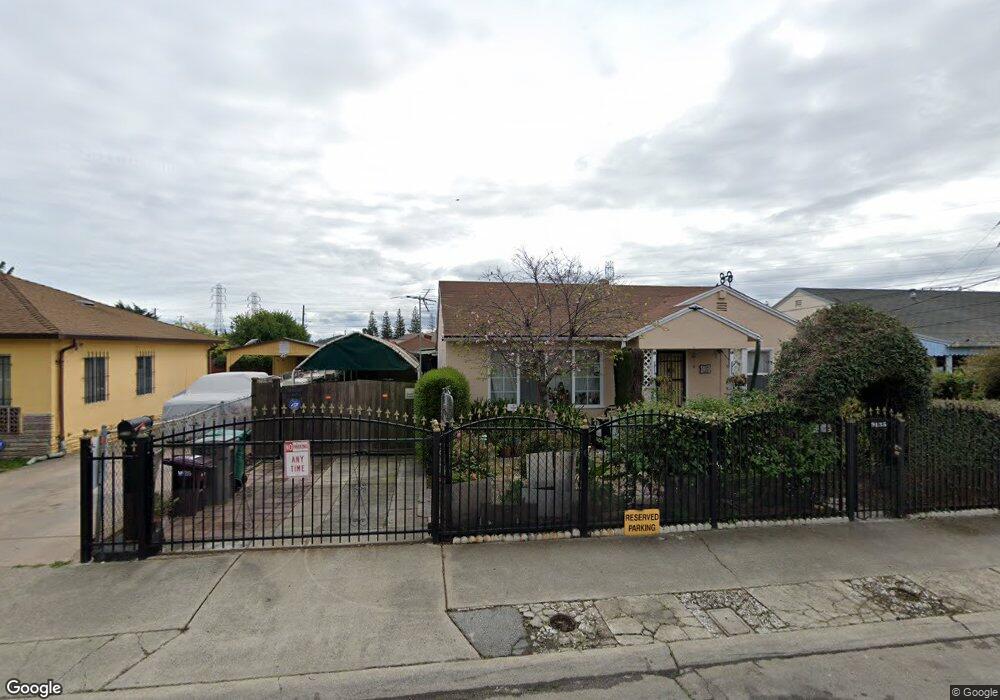
9135 Date St Oakland, CA 94603
Highland NeighborhoodEstimated Value: $503,000 - $719,000
4
Beds
1
Bath
1,239
Sq Ft
$451/Sq Ft
Est. Value
About This Home
This home is located at 9135 Date St, Oakland, CA 94603 and is currently estimated at $559,297, approximately $451 per square foot. 9135 Date St is a home located in Alameda County with nearby schools including Brookfield Elementary School, Madison Park Academy (6-12), and Coliseum College Prep Academy.
Ownership History
Date
Name
Owned For
Owner Type
Purchase Details
Closed on
Oct 28, 2019
Sold by
Duong Stanley Tuan
Bought by
Duong Stanley Tuan and Stanley Tuan Duong Living Trus
Current Estimated Value
Purchase Details
Closed on
Jul 25, 2009
Sold by
Duong Stanley Tuan
Bought by
Duong Stanley Tuan and The Stanley Tuan Duong Living
Purchase Details
Closed on
Mar 21, 2009
Sold by
Duong Stanley Tuan and Duong Tuan
Bought by
Duong Stanley Tuan
Home Financials for this Owner
Home Financials are based on the most recent Mortgage that was taken out on this home.
Original Mortgage
$109,600
Interest Rate
5.15%
Mortgage Type
New Conventional
Create a Home Valuation Report for This Property
The Home Valuation Report is an in-depth analysis detailing your home's value as well as a comparison with similar homes in the area
Home Values in the Area
Average Home Value in this Area
Purchase History
| Date | Buyer | Sale Price | Title Company |
|---|---|---|---|
| Duong Stanley Tuan | -- | None Available | |
| Duong Stanley Tuan | -- | None Available | |
| Duong Stanley Tuan | -- | None Available | |
| Duong Stanley Tuan | -- | Chicago Title Company |
Source: Public Records
Mortgage History
| Date | Status | Borrower | Loan Amount |
|---|---|---|---|
| Closed | Duong Stanley Tuan | $109,600 |
Source: Public Records
Tax History
| Year | Tax Paid | Tax Assessment Tax Assessment Total Assessment is a certain percentage of the fair market value that is determined by local assessors to be the total taxable value of land and additions on the property. | Land | Improvement |
|---|---|---|---|---|
| 2025 | $3,457 | $123,620 | $39,186 | $91,434 |
| 2024 | $3,457 | $121,058 | $38,417 | $89,641 |
| 2023 | $3,501 | $125,548 | $37,664 | $87,884 |
| 2022 | $3,336 | $116,086 | $36,926 | $86,160 |
| 2021 | $3,046 | $113,673 | $36,202 | $84,471 |
| 2020 | $3,007 | $119,436 | $35,831 | $83,605 |
| 2019 | $2,803 | $117,094 | $35,128 | $81,966 |
| 2018 | $2,743 | $114,798 | $34,439 | $80,359 |
| 2017 | $2,603 | $112,548 | $33,764 | $78,784 |
| 2016 | $2,429 | $110,341 | $33,102 | $77,239 |
| 2015 | $2,409 | $108,684 | $32,605 | $76,079 |
| 2014 | $2,277 | $106,556 | $31,967 | $74,589 |
Source: Public Records
Map
Nearby Homes
Your Personal Tour Guide
Ask me questions while you tour the home.