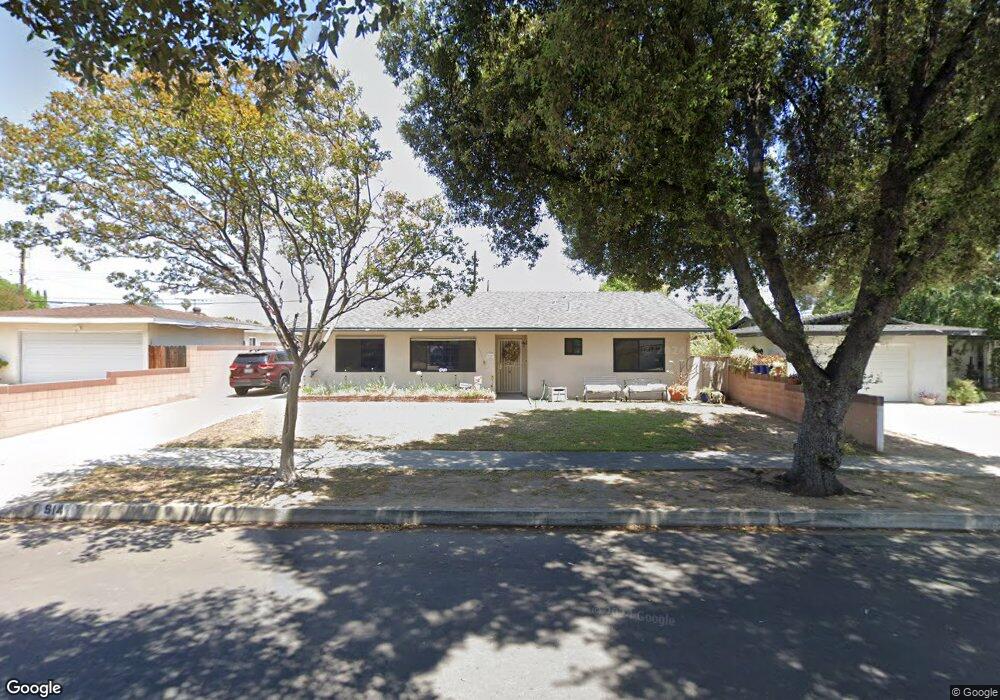
914 N Bender Ave Covina, CA 91724
Estimated Value: $795,395 - $864,000
3
Beds
2
Baths
1,501
Sq Ft
$556/Sq Ft
Est. Value
About This Home
This home is located at 914 N Bender Ave, Covina, CA 91724 and is currently estimated at $833,849, approximately $555 per square foot. 914 N Bender Ave is a home located in Los Angeles County with nearby schools including Cedargrove Elementary School, Royal Oak Middle School, and Charter Oak High School.
Ownership History
Date
Name
Owned For
Owner Type
Purchase Details
Closed on
Jan 31, 2011
Sold by
Artiago Maurey Kimo
Bought by
Artiago Maurey Kimo and Menn Sue
Current Estimated Value
Purchase Details
Closed on
Jan 30, 2011
Sold by
Artiago Maurey Kimo
Bought by
Artiago Maurey Kimo and Menn Sue
Purchase Details
Closed on
May 29, 2002
Sold by
Menn Sue
Bought by
Artiago Maurey Kimo
Purchase Details
Closed on
Apr 10, 1998
Sold by
Dube Michael R
Bought by
Artiago Maurey Kimo
Home Financials for this Owner
Home Financials are based on the most recent Mortgage that was taken out on this home.
Original Mortgage
$169,100
Interest Rate
7.06%
Purchase Details
Closed on
Aug 12, 1993
Sold by
American Baptist Credit Union
Bought by
Dube Michael R
Home Financials for this Owner
Home Financials are based on the most recent Mortgage that was taken out on this home.
Original Mortgage
$133,660
Interest Rate
7.16%
Mortgage Type
Seller Take Back
Create a Home Valuation Report for This Property
The Home Valuation Report is an in-depth analysis detailing your home's value as well as a comparison with similar homes in the area
Home Values in the Area
Average Home Value in this Area
Purchase History
| Date | Buyer | Sale Price | Title Company |
|---|---|---|---|
| Artiago Maurey Kimo | -- | Accommodation | |
| Artiago Maurey Kimo | -- | Accommodation | |
| Artiago Maurey Kimo | -- | Lawyers Title Company | |
| Artiago Maurey Kimo | $178,000 | Lawyers Title Company | |
| Dube Michael R | $147,000 | Old Republic Title Company |
Source: Public Records
Mortgage History
| Date | Status | Borrower | Loan Amount |
|---|---|---|---|
| Previous Owner | Artiago Maurey Kimo | $169,100 | |
| Previous Owner | Dube Michael R | $133,660 |
Source: Public Records
Tax History
| Year | Tax Paid | Tax Assessment Tax Assessment Total Assessment is a certain percentage of the fair market value that is determined by local assessors to be the total taxable value of land and additions on the property. | Land | Improvement |
|---|---|---|---|---|
| 2025 | $3,756 | $284,193 | $130,282 | $153,911 |
| 2024 | $3,756 | $278,622 | $127,728 | $150,894 |
| 2023 | $3,671 | $273,160 | $125,224 | $147,936 |
| 2022 | $3,626 | $267,805 | $122,769 | $145,036 |
| 2021 | $3,570 | $262,555 | $120,362 | $142,193 |
| 2020 | $3,534 | $259,863 | $119,128 | $140,735 |
| 2019 | $3,497 | $254,769 | $116,793 | $137,976 |
| 2018 | $3,260 | $249,774 | $114,503 | $135,271 |
| 2016 | $3,107 | $240,076 | $110,057 | $130,019 |
| 2015 | $3,092 | $236,470 | $108,404 | $128,066 |
| 2014 | $3,089 | $231,839 | $106,281 | $125,558 |
Source: Public Records
Map
Nearby Homes
- 905 N Bender Ave
- 19555 E Cypress St Unit P
- 19548 E Cypress St Unit 3
- 19548 E Cypress St Unit 17
- 19548 E Cypress St
- 19548 E Cypress St Unit 33
- 716 N Grand Ave Unit E2
- 716 N Grand Ave Unit J4
- 716 N Grand Ave Unit I-5
- 716 N Grand Ave Unit H3
- 716 N Grand Ave Unit A8
- 716 N Grand Ave Unit A-7
- 4900 N Grand Ave Unit 130
- 4900 N Grand Ave Unit 215
- 4900 N Grand Ave Unit 212
- 4900 N Grand Ave Unit 322
- 4900 N Grand Ave Unit 206
- 19319 E Greenhaven St
- 922 E Edgecomb St
- 445 N Mangrove Ave
- 922 N Bender Ave
- 1044 E Benbow St
- 915 N Bender Ave
- 1054 E Benbow St
- 923 N Bender Ave
- 938 N Bender Ave
- 21227 E Cypress St
- 929 N Bender Ave
- 939 N Dodsworth Ave
- 946 N Bender Ave
- 937 N Bender Ave
- 1068 E Benbow St
- 947 N Dodsworth Ave
- 947 N Bender Ave
- 954 N Bender Ave
- 835 N Dodsworth Ave
- 955 N Dodsworth Ave
- 930 N Dodsworth Ave
- 19555 E Cypress St Unit W
- 19555 E Cypress St Unit V
Your Personal Tour Guide
Ask me questions while you tour the home.