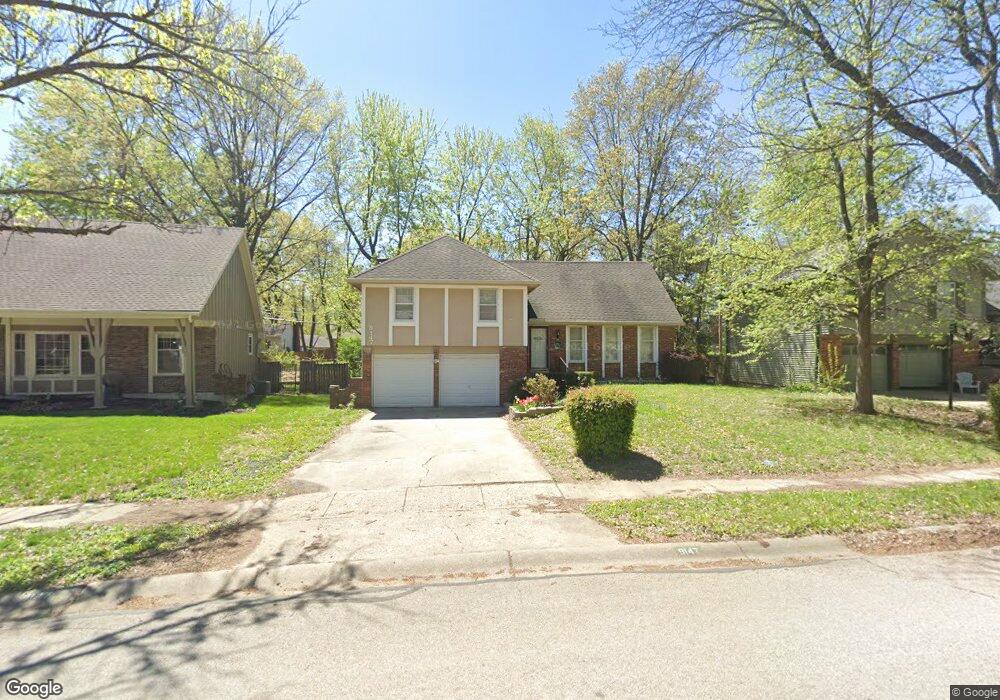
9147 W 92nd Place Overland Park, KS 66212
Elmhurst NeighborhoodEstimated Value: $365,000 - $385,010
4
Beds
3
Baths
1,679
Sq Ft
$222/Sq Ft
Est. Value
About This Home
This home is located at 9147 W 92nd Place, Overland Park, KS 66212 and is currently estimated at $372,753, approximately $222 per square foot. 9147 W 92nd Place is a home located in Johnson County with nearby schools including Pawnee Elementary School, Westridge Middle School, and Shawnee Mission West High School.
Ownership History
Date
Name
Owned For
Owner Type
Purchase Details
Closed on
May 11, 2018
Sold by
Mcvey Jem H and Mcvey Jutaporn
Bought by
Mcvey Jem H and Mcvey Jutaponne Gib
Current Estimated Value
Purchase Details
Closed on
Mar 27, 2009
Sold by
Federal National Mortgage Association
Bought by
Mcvey Jem H and Mcvey Jutaporn
Home Financials for this Owner
Home Financials are based on the most recent Mortgage that was taken out on this home.
Original Mortgage
$100,000
Interest Rate
5.14%
Mortgage Type
Purchase Money Mortgage
Purchase Details
Closed on
Apr 21, 2008
Sold by
Brown Mark L and Brown Bobbie L
Bought by
Federal National Mortgage Association
Purchase Details
Closed on
Jun 27, 2001
Sold by
Biggs Nancy Bootman
Bought by
Brown Mark L and Brown Bobbie L
Home Financials for this Owner
Home Financials are based on the most recent Mortgage that was taken out on this home.
Original Mortgage
$148,291
Interest Rate
7.11%
Mortgage Type
FHA
Create a Home Valuation Report for This Property
The Home Valuation Report is an in-depth analysis detailing your home's value as well as a comparison with similar homes in the area
Home Values in the Area
Average Home Value in this Area
Purchase History
| Date | Buyer | Sale Price | Title Company |
|---|---|---|---|
| Mcvey Jem H | -- | None Available | |
| Mcvey Jem H | -- | Stewart Title | |
| Federal National Mortgage Association | $163,663 | None Available | |
| Brown Mark L | -- | Chicago Title Insurance Co |
Source: Public Records
Mortgage History
| Date | Status | Borrower | Loan Amount |
|---|---|---|---|
| Previous Owner | Mcvey Jem H | $100,000 | |
| Previous Owner | Brown Mark L | $148,291 |
Source: Public Records
Tax History Compared to Growth
Tax History
| Year | Tax Paid | Tax Assessment Tax Assessment Total Assessment is a certain percentage of the fair market value that is determined by local assessors to be the total taxable value of land and additions on the property. | Land | Improvement |
|---|---|---|---|---|
| 2024 | $3,199 | $33,431 | $9,384 | $24,047 |
| 2023 | $3,028 | $31,062 | $8,532 | $22,530 |
| 2022 | $2,790 | $28,842 | $8,532 | $20,310 |
| 2021 | $2,790 | $26,611 | $7,756 | $18,855 |
| 2020 | $2,579 | $25,311 | $6,748 | $18,563 |
| 2019 | $2,306 | $22,667 | $4,505 | $18,162 |
| 2018 | $2,211 | $21,643 | $4,505 | $17,138 |
| 2017 | $1,938 | $18,688 | $4,505 | $14,183 |
| 2016 | $1,915 | $18,159 | $4,505 | $13,654 |
| 2015 | $1,742 | $16,882 | $4,505 | $12,377 |
| 2013 | -- | $17,009 | $4,505 | $12,504 |
Source: Public Records
Map
Nearby Homes
- 9146 W 92nd Place
- 9193 W 92nd Place
- 9406 Kessler Ln
- 9303 Hayes Dr
- 9303 Grant Dr
- 9020 Grandview Dr
- 9503 Grandview St
- 9135 Hayes Dr
- 9028 Grant St
- 9531 Kessler St
- 9121 Hayes Dr
- 9310 W 90th St
- 9605 Eby St
- 8926 Grant St
- 8315 W 91st Terrace
- 9314 W 89th Terrace
- 8947 Knox Ln
- 8931 Knox Ln
- 8805 Grandview St
- 9415 Moody Park Dr
- 9135 W 92nd Place
- 9002 W 93rd St
- 9004 W 93rd St
- 9171 W 92nd Place
- 8916 W 93rd St
- 9008 W 93rd St
- 9122 W 92nd Place
- 9134 W 92nd Place
- 8914 W 93rd St
- 9183 W 92nd Place
- 9012 W 93rd St
- 9100 W 92nd Place
- 9109 W 92nd Place
- 9158 W 92nd Place
- 9241 Grandview Dr
- 8912 W 93rd St
- 9014 W 93rd St
- 9170 W 92nd Place
- 9189 W 92nd Place