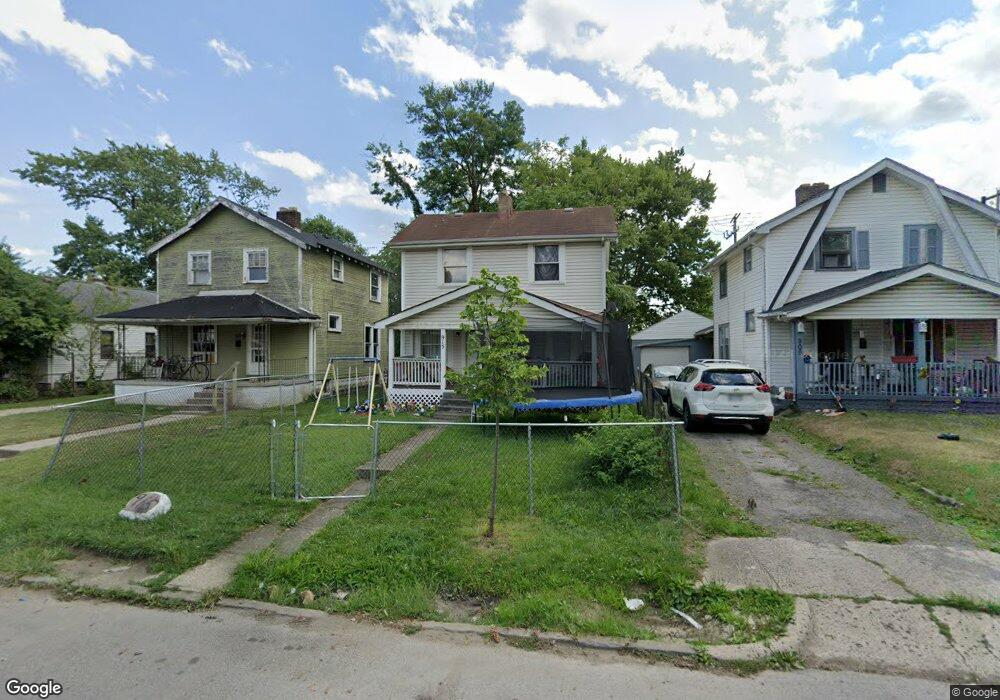
915 E 18th Ave Columbus, OH 43211
South Linden NeighborhoodEstimated Value: $128,354 - $144,000
3
Beds
1
Bath
1,008
Sq Ft
$135/Sq Ft
Est. Value
About This Home
This home is located at 915 E 18th Ave, Columbus, OH 43211 and is currently estimated at $135,589, approximately $134 per square foot. 915 E 18th Ave is a home located in Franklin County with nearby schools including Linden-Mckinley Stem School On Arcadia, North Columbus Preparatory Academy, and Graham Elementary and Middle School.
Ownership History
Date
Name
Owned For
Owner Type
Purchase Details
Closed on
Apr 20, 2017
Sold by
City Of Columbus Ohio
Bought by
Abuyassen Ghadeer
Current Estimated Value
Purchase Details
Closed on
Apr 18, 2016
Sold by
Ma Leon
Bought by
City Of Columbus
Purchase Details
Closed on
Nov 19, 2007
Sold by
Lq Investments Llc
Bought by
Ma Leon
Home Financials for this Owner
Home Financials are based on the most recent Mortgage that was taken out on this home.
Original Mortgage
$52,500
Interest Rate
6.47%
Mortgage Type
Purchase Money Mortgage
Purchase Details
Closed on
Feb 10, 2005
Sold by
Jp Morgan Chase Bank
Bought by
Lq Investments Llc
Purchase Details
Closed on
Oct 28, 2004
Sold by
Dawson Charles Lee and The Chase Manhattan Bank
Bought by
Jp Morgan Chase Bank and The Chase Manhattan Bank
Purchase Details
Closed on
Dec 17, 1992
Bought by
Dawson Charles L
Create a Home Valuation Report for This Property
The Home Valuation Report is an in-depth analysis detailing your home's value as well as a comparison with similar homes in the area
Home Values in the Area
Average Home Value in this Area
Purchase History
| Date | Buyer | Sale Price | Title Company |
|---|---|---|---|
| Abuyassen Ghadeer | -- | None Available | |
| City Of Columbus | -- | None Available | |
| Ma Leon | -- | Title And | |
| Lq Investments Llc | $20,000 | Resource T | |
| Jp Morgan Chase Bank | $26,000 | Resource T | |
| Dawson Charles L | -- | -- |
Source: Public Records
Mortgage History
| Date | Status | Borrower | Loan Amount |
|---|---|---|---|
| Previous Owner | Ma Leon | $52,500 |
Source: Public Records
Tax History
| Year | Tax Paid | Tax Assessment Tax Assessment Total Assessment is a certain percentage of the fair market value that is determined by local assessors to be the total taxable value of land and additions on the property. | Land | Improvement |
|---|---|---|---|---|
| 2025 | $3,016 | $40,250 | $5,180 | $35,070 |
| 2024 | $3,016 | $40,250 | $5,180 | $35,070 |
| 2023 | $2,060 | $40,250 | $5,180 | $35,070 |
| 2022 | $907 | $14,250 | $2,490 | $11,760 |
| 2021 | $1,374 | $14,250 | $2,490 | $11,760 |
| 2020 | $1,009 | $14,250 | $2,490 | $11,760 |
| 2019 | $892 | $11,940 | $2,070 | $9,870 |
| 2018 | $1,052 | $11,940 | $2,070 | $9,870 |
| 2017 | $725 | $11,940 | $2,070 | $9,870 |
| 2016 | $4,507 | $11,380 | $3,010 | $8,370 |
| 2015 | $1,363 | $11,380 | $3,010 | $8,370 |
| 2014 | $706 | $11,380 | $3,010 | $8,370 |
| 2013 | $677 | $12,635 | $3,325 | $9,310 |
Source: Public Records
Map
Nearby Homes
- 914-916 E 17th Ave
- 957 E 17th Ave
- 0 E 18th Ave
- 1705 Lexington Ave
- 1045-1051 E 20th Ave
- 990 E 21st Ave
- 1047 E 21st Ave
- 915 E 13th Ave
- 1027 E 14th Ave
- 1033 E 22nd Ave
- 1129 E 17th Ave
- 1538-1542 Accommodation Ave
- 1136 E 21st Ave
- 1673 Cleveland Ave
- 957 E 12th Ave
- 1109 Windsor Ave Unit 1103
- 1201 E 20th Ave
- 1129 E 23rd Ave Unit 1129 - 1131
- 1111 Windsor Ave
- 1121 Windsor Ave
- 919 E 18th Ave
- 909 E 18th Ave
- 923 E 18th Ave
- 903 E 18th Ave
- 927 E 18th Ave
- 931 E 18th Ave Unit 933
- 931-933 E 18th Ave
- 906 E 17th Ave Unit 908
- 912 E 17th Ave
- 1097 E 18th Ave
- 1082 E 18th Ave
- 898 E 17th Ave
- 914 E 17th Ave Unit 916
- 914 E Ns 17th Ave Unit 914-916
- 916 E 18th Ave
- 920 E 18th Ave
- 912 E 18th Ave
- 920 E 17th Ave Unit 922
- 920-922 E 17th Ave
- 924 E 18th Ave
Your Personal Tour Guide
Ask me questions while you tour the home.