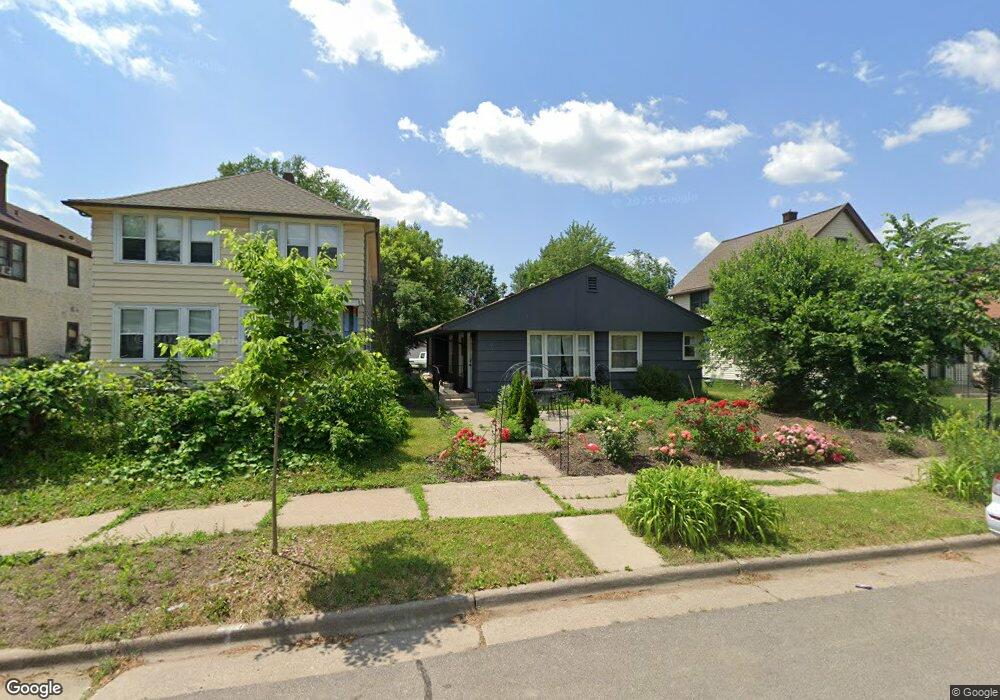
915 Sheridan Ave N Minneapolis, MN 55411
Willard-Hay NeighborhoodEstimated Value: $243,000 - $272,912
3
Beds
1
Bath
1,118
Sq Ft
$231/Sq Ft
Est. Value
About This Home
This home is located at 915 Sheridan Ave N, Minneapolis, MN 55411 and is currently estimated at $258,478, approximately $231 per square foot. 915 Sheridan Ave N is a home located in Hennepin County with nearby schools including Bryn Mawr Elementary School, Anwatin Middle School, and North Community High School.
Ownership History
Date
Name
Owned For
Owner Type
Purchase Details
Closed on
Feb 28, 2020
Sold by
Wolfgang Tyler
Bought by
Arei Christian
Current Estimated Value
Home Financials for this Owner
Home Financials are based on the most recent Mortgage that was taken out on this home.
Original Mortgage
$199,723
Outstanding Balance
$176,883
Interest Rate
3.5%
Mortgage Type
Stand Alone Second
Estimated Equity
$81,595
Purchase Details
Closed on
Apr 25, 2019
Sold by
Yang Wesley K and Yang Pamlee
Bought by
Wolfgang Tyler
Home Financials for this Owner
Home Financials are based on the most recent Mortgage that was taken out on this home.
Original Mortgage
$139,200
Interest Rate
4.3%
Mortgage Type
New Conventional
Purchase Details
Closed on
Oct 27, 2006
Sold by
Avent Mattie L
Bought by
Yang Camelee and Yang Wesley U
Create a Home Valuation Report for This Property
The Home Valuation Report is an in-depth analysis detailing your home's value as well as a comparison with similar homes in the area
Home Values in the Area
Average Home Value in this Area
Purchase History
| Date | Buyer | Sale Price | Title Company |
|---|---|---|---|
| Arei Christian | $205,900 | Watermark Title Agency | |
| Wolfgang Tyler | $174,000 | Titlesmart Inc | |
| Yang Camelee | $111,000 | -- |
Source: Public Records
Mortgage History
| Date | Status | Borrower | Loan Amount |
|---|---|---|---|
| Open | Arei Christian | $199,723 | |
| Closed | Arei Christian | $199,723 | |
| Previous Owner | Wolfgang Tyler | $139,200 |
Source: Public Records
Tax History Compared to Growth
Tax History
| Year | Tax Paid | Tax Assessment Tax Assessment Total Assessment is a certain percentage of the fair market value that is determined by local assessors to be the total taxable value of land and additions on the property. | Land | Improvement |
|---|---|---|---|---|
| 2024 | $3,539 | $260,000 | $24,000 | $236,000 |
| 2023 | $3,400 | $273,000 | $24,000 | $249,000 |
| 2022 | $2,029 | $237,000 | $16,000 | $221,000 |
| 2021 | $1,625 | $167,000 | $17,000 | $150,000 |
| 2020 | $1,560 | $143,500 | $14,400 | $129,100 |
| 2019 | $1,964 | $130,500 | $10,600 | $119,900 |
| 2018 | $1,915 | $113,500 | $10,600 | $102,900 |
| 2017 | $1,522 | $99,500 | $9,600 | $89,900 |
| 2016 | $1,484 | $94,000 | $9,600 | $84,400 |
| 2015 | $1,456 | $88,000 | $9,600 | $78,400 |
| 2014 | -- | $88,000 | $9,600 | $78,400 |
Source: Public Records
Map
Nearby Homes
- 819 Sheridan Ave N
- 723 Sheridan Ave N
- 905 Queen Ave N
- 918 Queen Ave N
- 701 Vincent Ave N
- 1214 Penn Ave N
- 722 Newton Ave N
- 2224 4th Ave N
- 1332 Upton Ave N
- 1336 Russell Ave N
- 2713 Glenwood Ave
- 2108 Glenwood Ave
- 1400 Queen Ave N
- 1423 Penn Ave N
- 1028 Knox Ave N
- 1030 Knox Ave N
- 426 Logan Ave N
- 1501 Vincent Ave N
- 1418 Oliver Ave N
- 1123 James Ave N
- 919 Sheridan Ave N
- 911 Sheridan Ave N
- 907 Sheridan Ave N
- 923 Sheridan Ave N
- 903 Sheridan Ave N
- 903 Sheridan Ave N
- 903 Sheridan Ave N Unit Upper Unit
- 903 Sheridan Ave N Unit Lower Unit
- 927 Sheridan Ave N
- 914 Thomas Ave N
- 910 Thomas Ave N
- 918 Thomas Ave N
- 922 Thomas Ave N
- 914 Sheridan Ave N
- 902 Thomas Ave N
- 831 Sheridan Ave N
- 918 Sheridan Ave N
- 910 Sheridan Ave N
- 926 Thomas Ave N
- 922 Sheridan Ave N