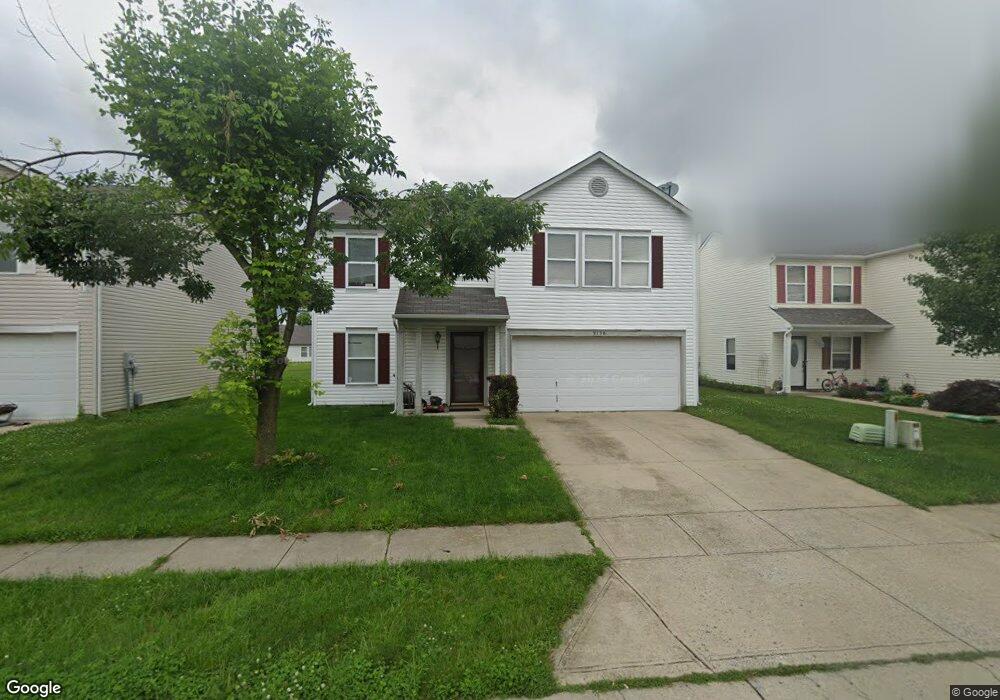
9150 Amberleigh Dr Plainfield, IN 46168
Estimated Value: $278,048 - $300,000
3
Beds
3
Baths
2,112
Sq Ft
$137/Sq Ft
Est. Value
About This Home
This home is located at 9150 Amberleigh Dr, Plainfield, IN 46168 and is currently estimated at $290,262, approximately $137 per square foot. 9150 Amberleigh Dr is a home located in Hendricks County with nearby schools including White Oak Elementary School, Cedar Elementary School, and Avon Intermediate School West.
Ownership History
Date
Name
Owned For
Owner Type
Purchase Details
Closed on
Oct 8, 2010
Sold by
Curry Rose M
Bought by
Curry Lloyd D
Current Estimated Value
Create a Home Valuation Report for This Property
The Home Valuation Report is an in-depth analysis detailing your home's value as well as a comparison with similar homes in the area
Home Values in the Area
Average Home Value in this Area
Purchase History
| Date | Buyer | Sale Price | Title Company |
|---|---|---|---|
| Curry Lloyd D | -- | First American Title Ins Co |
Source: Public Records
Tax History
| Year | Tax Paid | Tax Assessment Tax Assessment Total Assessment is a certain percentage of the fair market value that is determined by local assessors to be the total taxable value of land and additions on the property. | Land | Improvement |
|---|---|---|---|---|
| 2025 | $2,274 | $221,600 | $43,000 | $178,600 |
| 2024 | $2,274 | $204,000 | $43,000 | $161,000 |
| 2023 | $2,220 | $200,100 | $39,100 | $161,000 |
| 2022 | $2,146 | $192,300 | $37,200 | $155,100 |
| 2021 | $1,913 | $171,500 | $34,800 | $136,700 |
| 2020 | $1,780 | $158,800 | $34,800 | $124,000 |
| 2019 | $1,651 | $146,300 | $31,600 | $114,700 |
| 2018 | $1,615 | $141,200 | $31,600 | $109,600 |
| 2017 | $1,370 | $137,000 | $30,700 | $106,300 |
| 2016 | $1,348 | $134,800 | $30,700 | $104,100 |
| 2014 | $1,249 | $124,900 | $28,100 | $96,800 |
Source: Public Records
Map
Nearby Homes
- 9127 Haverhill Ln
- 9113 Haverhill Ln
- 2625 Prism Way
- 2271 Hampton Ct
- 2253 Summerfield Dr
- 2571 Penn Ave
- 2642 Marjorie Ln
- 2644 Marjorie Ln
- 2646 Marjorie Ln
- 2648 Marjorie Ln
- 2650 Marjorie Ln
- 2736 Evergreen Ave
- 2657 Penn Ave
- 2643 Marjorie Ln
- 2645 Marjorie Ln
- 2669 Penn Ave
- 2647 Marjorie Ln
- 2651 Marjorie Ln
- 2670 Marjorie Ln
- 9299 Loyola Way
- 9160 Amberleigh Dr
- 9140 Amberleigh Dr
- 9170 Amberleigh Dr
- 2418 Woodmont Ct
- 9130 Amberleigh Dr
- 2465 Amberleigh Dr
- 2404 Woodmont Ct
- 9180 Amberleigh Dr
- 2426 Woodmont Ct
- 2455 Amberleigh Dr
- 9151 Amberleigh Dr
- 9161 Amberleigh Dr
- 9141 Amberleigh Dr
- 2413 Shadowbrook Dr
- 9171 Amberleigh Dr
- 9190 Amberleigh Dr
- 9131 Amberleigh Dr
- 2401 Shadowbrook Dr
- 2425 Woodmont Ct
- 9181 Amberleigh Dr
Your Personal Tour Guide
Ask me questions while you tour the home.