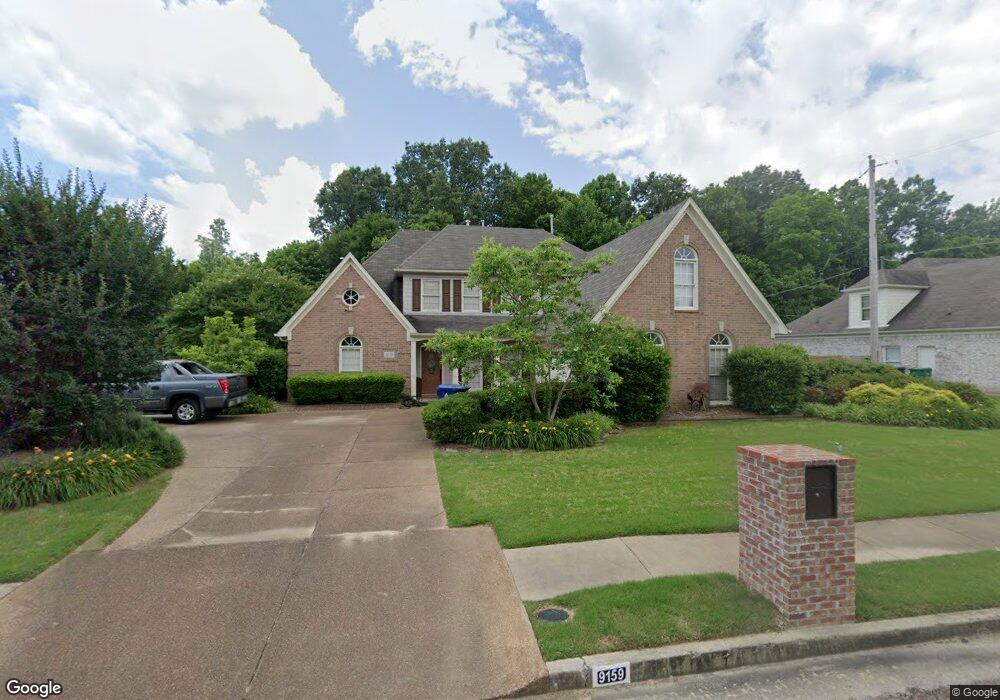
9159 Raspberry Ln Cordova, TN 38016
Cordova NeighborhoodEstimated Value: $314,000 - $356,000
3
Beds
3
Baths
3,255
Sq Ft
$103/Sq Ft
Est. Value
About This Home
This home is located at 9159 Raspberry Ln, Cordova, TN 38016 and is currently estimated at $336,685, approximately $103 per square foot. 9159 Raspberry Ln is a home located in Shelby County with nearby schools including Riverwood Elementary School, Mt. Pisgah Middle School, and Germantown High School.
Ownership History
Date
Name
Owned For
Owner Type
Purchase Details
Closed on
Jul 9, 2021
Sold by
Belk Micahel Sean
Bought by
Belk Meliana S and Belk Michael Sean
Current Estimated Value
Purchase Details
Closed on
Dec 6, 2001
Sold by
Mark Matthews Development Llc
Bought by
Belk Michael and Belk Carrie
Home Financials for this Owner
Home Financials are based on the most recent Mortgage that was taken out on this home.
Original Mortgage
$211,600
Outstanding Balance
$92,489
Interest Rate
8.5%
Estimated Equity
$244,196
Purchase Details
Closed on
Jun 12, 2000
Sold by
Califf Cary R
Bought by
Mark Matthews Development Llc
Home Financials for this Owner
Home Financials are based on the most recent Mortgage that was taken out on this home.
Original Mortgage
$193,600
Interest Rate
8.27%
Mortgage Type
Construction
Create a Home Valuation Report for This Property
The Home Valuation Report is an in-depth analysis detailing your home's value as well as a comparison with similar homes in the area
Home Values in the Area
Average Home Value in this Area
Purchase History
| Date | Buyer | Sale Price | Title Company |
|---|---|---|---|
| Belk Meliana S | -- | None Available | |
| Belk Michael | $264,500 | -- | |
| Mark Matthews Development Llc | $45,000 | -- | |
| Mark Matthews Development Llc | $45,000 | -- |
Source: Public Records
Mortgage History
| Date | Status | Borrower | Loan Amount |
|---|---|---|---|
| Open | Belk Michael | $211,600 | |
| Previous Owner | Mark Matthews Development Llc | $193,600 | |
| Closed | Belk Michael | $52,900 |
Source: Public Records
Tax History
| Year | Tax Paid | Tax Assessment Tax Assessment Total Assessment is a certain percentage of the fair market value that is determined by local assessors to be the total taxable value of land and additions on the property. | Land | Improvement |
|---|---|---|---|---|
| 2025 | $2,056 | $81,150 | $17,500 | $63,650 |
| 2024 | $2,056 | $60,650 | $12,550 | $48,100 |
| 2023 | $2,056 | $60,650 | $12,550 | $48,100 |
| 2022 | $2,056 | $60,650 | $12,550 | $48,100 |
| 2021 | $2,092 | $60,650 | $12,550 | $48,100 |
| 2020 | $1,805 | $44,575 | $12,550 | $32,025 |
| 2019 | $1,805 | $44,575 | $12,550 | $32,025 |
| 2018 | $1,805 | $44,575 | $12,550 | $32,025 |
| 2017 | $1,832 | $44,575 | $12,550 | $32,025 |
| 2016 | $1,802 | $41,225 | $0 | $0 |
| 2014 | $1,802 | $41,225 | $0 | $0 |
Source: Public Records
Map
Nearby Homes
- 1680 Berryhill Rd
- 9107 Raspberry Ln
- 1645 Hailsham Cove
- 9275 Durhamshire Dr
- 1700 Belledeer Dr W
- 9054 Chimneyrock Blvd
- 1916 Bohemia Dr
- 9284 Chimneyrock Blvd
- 8875 Linell Cove
- 1868 Helmsley Cove
- 8952 Vorlich Cove
- 8863 Toth Cove
- 8882 Chimneyrock Blvd
- 8831 Wood Mills Cove E
- 9375 Brancaster Dr
- 1943 Milbrey St
- 8739 Cedar Mills Cir
- 8766 Wood Mills Cove W
- 1356 Cedar Hollow Dr
- 1362 Cedar Run Cove
- 9149 Raspberry Ln
- 9158 Raspberry Ln
- 9148 Raspberry Ln
- 9143 Raspberry Ln
- 1644 Berryhill Rd
- 1656 Berryhill Rd
- 9138 Raspberry Ln
- 1636 Berryhill Rd
- 1677 Berryhill Rd
- 1664 Berryhill Rd
- 9137 Raspberry Ln
- 9200 Durhamshire Dr
- 1670 Berryhill Rd
- 1684 Huntgate Cove
- 9128 Raspberry Ln
- 9131 Raspberry Ln
- 1687 Berryhill Rd
- 1647 Grangewood Cove
- 1639 Grangewood Cove
- 1655 Grangewood Cove
Your Personal Tour Guide
Ask me questions while you tour the home.