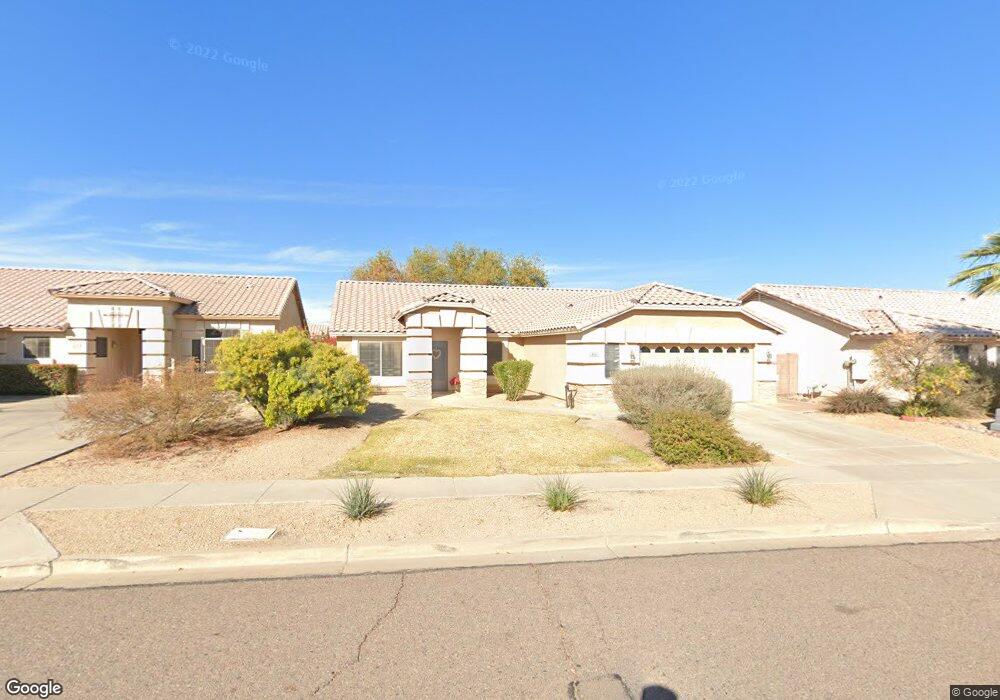
916 E Gary Ln Phoenix, AZ 85042
South Mountain NeighborhoodEstimated Value: $432,235 - $471,000
4
Beds
2
Baths
2,062
Sq Ft
$220/Sq Ft
Est. Value
About This Home
This home is located at 916 E Gary Ln, Phoenix, AZ 85042 and is currently estimated at $453,559, approximately $219 per square foot. 916 E Gary Ln is a home located in Maricopa County with nearby schools including Maxine O. Bush Elementary School, South Mountain High School, and Phoenix Coding Academy.
Ownership History
Date
Name
Owned For
Owner Type
Purchase Details
Closed on
Mar 26, 2016
Sold by
Renteria Daniel T and Renteria Linda S
Bought by
Renteria Linda S
Current Estimated Value
Purchase Details
Closed on
Jul 20, 2010
Sold by
Martinez Joe L and Martinez Viola B
Bought by
Korman Linda S
Home Financials for this Owner
Home Financials are based on the most recent Mortgage that was taken out on this home.
Original Mortgage
$128,272
Outstanding Balance
$85,366
Interest Rate
4.75%
Mortgage Type
FHA
Estimated Equity
$368,193
Purchase Details
Closed on
Nov 8, 2000
Sold by
Rising Star Inc
Bought by
Martinez Joe L and Martinez Viola B
Home Financials for this Owner
Home Financials are based on the most recent Mortgage that was taken out on this home.
Original Mortgage
$134,250
Interest Rate
7.82%
Create a Home Valuation Report for This Property
The Home Valuation Report is an in-depth analysis detailing your home's value as well as a comparison with similar homes in the area
Home Values in the Area
Average Home Value in this Area
Purchase History
| Date | Buyer | Sale Price | Title Company |
|---|---|---|---|
| Renteria Linda S | -- | Nextitle | |
| Renteria Linda S | -- | Nextitle | |
| Korman Linda S | $130,000 | Stewart Title & Trust Of Pho | |
| Martinez Joe L | $149,712 | Old Republic Title Agency |
Source: Public Records
Mortgage History
| Date | Status | Borrower | Loan Amount |
|---|---|---|---|
| Open | Korman Linda S | $128,272 | |
| Previous Owner | Martinez Joe L | $134,250 |
Source: Public Records
Tax History
| Year | Tax Paid | Tax Assessment Tax Assessment Total Assessment is a certain percentage of the fair market value that is determined by local assessors to be the total taxable value of land and additions on the property. | Land | Improvement |
|---|---|---|---|---|
| 2025 | $2,268 | $16,782 | -- | -- |
| 2024 | $2,143 | $15,982 | -- | -- |
| 2023 | $2,143 | $32,080 | $6,410 | $25,670 |
| 2022 | $2,099 | $24,270 | $4,850 | $19,420 |
| 2021 | $2,164 | $23,420 | $4,680 | $18,740 |
| 2020 | $2,137 | $21,780 | $4,350 | $17,430 |
| 2019 | $2,065 | $19,100 | $3,820 | $15,280 |
| 2018 | $2,006 | $18,730 | $3,740 | $14,990 |
| 2017 | $1,869 | $16,020 | $3,200 | $12,820 |
| 2016 | $1,774 | $15,370 | $3,070 | $12,300 |
| 2015 | $1,648 | $11,900 | $2,380 | $9,520 |
Source: Public Records
Map
Nearby Homes
- 907 E Gary Ln
- 836 E Gary Ln
- 916 E Harwell Rd
- 849 E Constance Way
- 1136 E Caldwell St
- 734 E Desert Dr S
- 1322 E Harwell Rd
- 930 E Pedro Rd
- 1022 E Pedro Rd
- 825 E Minton St
- 8218 S 7th St Unit 129
- 8218 S 7th St Unit 168
- 303 E South Mountain Ave Unit 100
- 7527 S 13th Place
- 1014 E Milada Dr
- 125 E South Mountain Ave
- 1516 E South Mountain Ave
- 7514 S 14th St
- 29 E Baseline Rd
- 720 E Dobbins Rd
- 912 E Gary Ln
- 922 E Gary Ln
- 915 E Beverly Rd
- 906 E Gary Ln
- 926 E Gary Ln
- 921 E Beverly Rd
- 911 E Beverly Rd
- 925 E Beverly Rd
- 913 E Gary Ln
- 917 E Gary Ln
- 905 E Beverly Rd
- 930 E Gary Ln
- 923 E Gary Ln
- 929 E Beverly Rd
- 927 E Gary Ln
- 934 E Gary Ln
- 933 E Beverly Rd
- 916 E Beverly Rd
- 922 E Beverly Rd
- 931 E Gary Ln
Your Personal Tour Guide
Ask me questions while you tour the home.