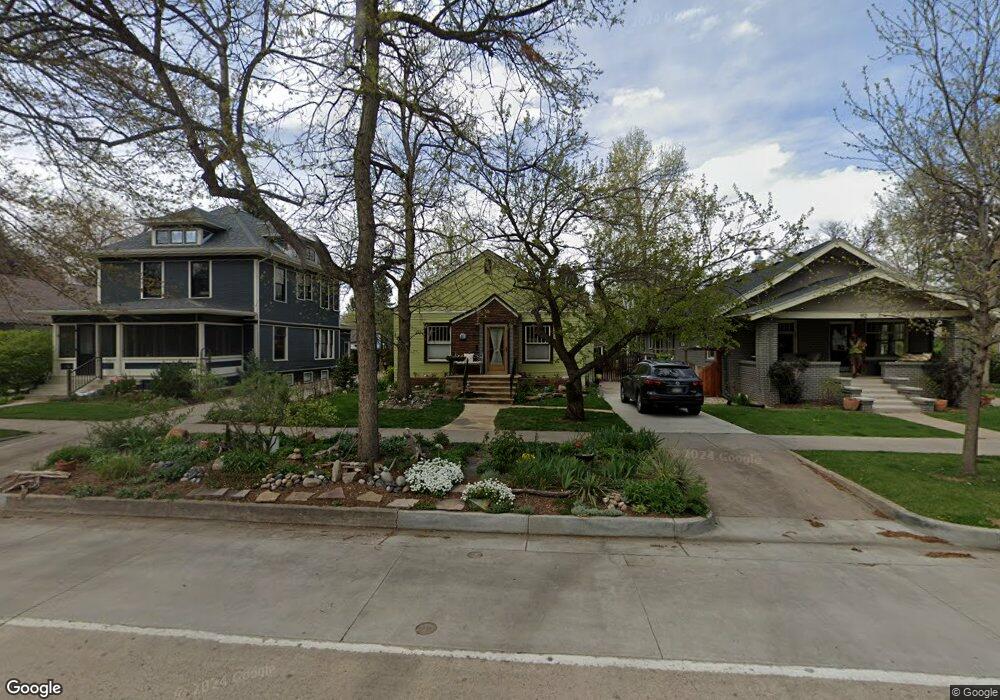
916 W Mountain Ave Fort Collins, CO 80521
Old Town West NeighborhoodEstimated Value: $784,015 - $1,034,000
4
Beds
2
Baths
2,244
Sq Ft
$426/Sq Ft
Est. Value
About This Home
This home is located at 916 W Mountain Ave, Fort Collins, CO 80521 and is currently estimated at $957,004, approximately $426 per square foot. 916 W Mountain Ave is a home located in Larimer County with nearby schools including Putnam Elementary School, Lincoln Middle School, and Poudre High School.
Ownership History
Date
Name
Owned For
Owner Type
Purchase Details
Closed on
Apr 29, 2011
Sold by
Viney Susan Tamara
Bought by
Brooks Marshall R and Brooks Jill T
Current Estimated Value
Home Financials for this Owner
Home Financials are based on the most recent Mortgage that was taken out on this home.
Original Mortgage
$288,000
Interest Rate
4.66%
Mortgage Type
New Conventional
Purchase Details
Closed on
Feb 29, 2000
Sold by
Skolnick Elliot A Herberst Lori J
Bought by
Viney Susan Tamara
Home Financials for this Owner
Home Financials are based on the most recent Mortgage that was taken out on this home.
Original Mortgage
$204,250
Interest Rate
8.31%
Purchase Details
Closed on
May 7, 1997
Sold by
Catlow Thomas Charles Debra Ann
Bought by
Skolnick Elliot A and Berberet Lori J
Home Financials for this Owner
Home Financials are based on the most recent Mortgage that was taken out on this home.
Original Mortgage
$138,700
Interest Rate
7.97%
Create a Home Valuation Report for This Property
The Home Valuation Report is an in-depth analysis detailing your home's value as well as a comparison with similar homes in the area
Home Values in the Area
Average Home Value in this Area
Purchase History
| Date | Buyer | Sale Price | Title Company |
|---|---|---|---|
| Brooks Marshall R | $419,000 | North Amer Title Co Of Co | |
| Viney Susan Tamara | $215,000 | Land Title | |
| Skolnick Elliot A | $146,000 | -- |
Source: Public Records
Mortgage History
| Date | Status | Borrower | Loan Amount |
|---|---|---|---|
| Previous Owner | Brooks Marshall R | $288,000 | |
| Previous Owner | Viney Susan Tamara | $204,250 | |
| Previous Owner | Skolnick Elliot A | $138,700 |
Source: Public Records
Tax History Compared to Growth
Tax History
| Year | Tax Paid | Tax Assessment Tax Assessment Total Assessment is a certain percentage of the fair market value that is determined by local assessors to be the total taxable value of land and additions on the property. | Land | Improvement |
|---|---|---|---|---|
| 2025 | $4,673 | $52,387 | $1,206 | $51,181 |
| 2024 | $4,446 | $52,387 | $1,206 | $51,181 |
| 2022 | $2,865 | $30,344 | $1,251 | $29,093 |
| 2021 | $2,896 | $31,217 | $1,287 | $29,930 |
| 2020 | $3,932 | $42,021 | $1,287 | $40,734 |
| 2019 | $3,949 | $42,021 | $1,287 | $40,734 |
| 2018 | $3,727 | $40,896 | $1,296 | $39,600 |
| 2017 | $3,715 | $40,896 | $1,296 | $39,600 |
| 2016 | $2,907 | $31,840 | $1,433 | $30,407 |
| 2015 | $2,886 | $34,290 | $1,430 | $32,860 |
| 2014 | $2,612 | $28,630 | $1,430 | $27,200 |
Source: Public Records
Map
Nearby Homes
- 1029 Laporte Ave
- 816 Maple St
- 317 Wood St
- 1031 W Oak St
- 219 N Shields St
- 1101 W Oak St
- 530 Laporte Ave
- 320 N Loomis Ave
- 313 N Whitcomb St
- 427 N Grant Ave
- 1116 Beech St
- 500 Wood St
- 1100 W Mulberry St
- 149 Sylvan Ct
- 401 W Mountain Ave Unit 301
- 620 W Mulberry St
- 234 N Mckinley Ave
- 408 Riddle Dr
- 233 N Meldrum St Unit 8
- 302 N Meldrum St Unit 206
- 912 W Mountain Ave
- 926 W Mountain Ave
- 906 W Mountain Ave
- 925 Bungalow Ct
- 930 W Mountain Ave
- 935 Bungalow Ct
- 109 N Washington Ave
- 900 W Mountain Ave
- 932 W Mountain Ave
- 115 N Washington Ave
- 945 Bungalow Ct
- 934 W Mountain Ave
- 123 N Washington Ave
- 955 Bungalow Ct
- 910 Bungalow Ct
- 125 N Washington Ave
- 930 Bungalow Ct
- 938 W Mountain Ave
- 911 W Mountain Ave
- 909 W Mountain Ave