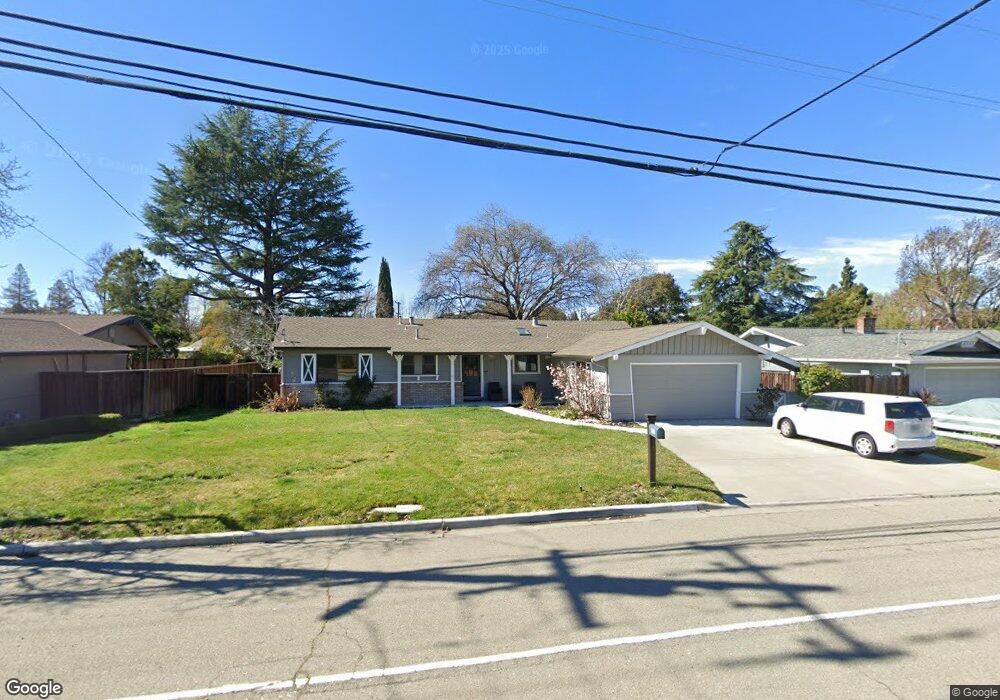
917 Bancroft Rd Walnut Creek, CA 94598
Contra Costa Centre NeighborhoodEstimated Value: $1,052,551 - $1,288,000
3
Beds
2
Baths
1,791
Sq Ft
$665/Sq Ft
Est. Value
About This Home
This home is located at 917 Bancroft Rd, Walnut Creek, CA 94598 and is currently estimated at $1,191,888, approximately $665 per square foot. 917 Bancroft Rd is a home located in Contra Costa County with nearby schools including Fair Oaks Elementary School, Pleasant Hill Middle School, and Ygnacio Valley High School.
Ownership History
Date
Name
Owned For
Owner Type
Purchase Details
Closed on
May 17, 2019
Sold by
Macdougall Jason
Bought by
Macdougall Jason C and Macdougall Jason
Current Estimated Value
Home Financials for this Owner
Home Financials are based on the most recent Mortgage that was taken out on this home.
Original Mortgage
$519,669
Outstanding Balance
$455,966
Interest Rate
4.1%
Mortgage Type
New Conventional
Estimated Equity
$735,922
Purchase Details
Closed on
May 18, 2018
Sold by
Macdougall Mandana
Bought by
Macdougall Jason
Purchase Details
Closed on
May 8, 2018
Sold by
Bush Jeannie Sue
Bought by
Macdougall Jason
Purchase Details
Closed on
Mar 5, 2018
Sold by
Macdougall Marilyn
Bought by
Bush Jeannie Sue
Purchase Details
Closed on
Dec 23, 2010
Sold by
Thomas Lillian
Bought by
Thomas Lilian
Purchase Details
Closed on
Jul 12, 2010
Sold by
Thomas Lillian
Bought by
Thomas Lillian
Create a Home Valuation Report for This Property
The Home Valuation Report is an in-depth analysis detailing your home's value as well as a comparison with similar homes in the area
Home Values in the Area
Average Home Value in this Area
Purchase History
| Date | Buyer | Sale Price | Title Company |
|---|---|---|---|
| Macdougall Jason C | $256,000 | North American Title Co Inc | |
| Macdougall Jason | -- | North American Title Company | |
| Macdougall Jason | $600,000 | North American Title Company | |
| Bush Jeannie Sue | -- | None Available | |
| Thomas Lilian | -- | None Available | |
| Thomas Lillian | -- | None Available |
Source: Public Records
Mortgage History
| Date | Status | Borrower | Loan Amount |
|---|---|---|---|
| Open | Macdougall Jason C | $519,669 |
Source: Public Records
Tax History
| Year | Tax Paid | Tax Assessment Tax Assessment Total Assessment is a certain percentage of the fair market value that is determined by local assessors to be the total taxable value of land and additions on the property. | Land | Improvement |
|---|---|---|---|---|
| 2025 | $10,578 | $877,853 | $721,962 | $155,891 |
| 2024 | $10,166 | $860,641 | $707,806 | $152,835 |
| 2023 | $10,166 | $843,767 | $693,928 | $149,839 |
| 2022 | $10,079 | $827,223 | $680,322 | $146,901 |
| 2021 | $9,855 | $811,004 | $666,983 | $144,021 |
| 2019 | $9,344 | $759,900 | $652,800 | $107,100 |
| 2018 | $1,743 | $93,545 | $40,263 | $53,282 |
| 2017 | $1,675 | $91,712 | $39,474 | $52,238 |
| 2016 | $1,615 | $89,914 | $38,700 | $51,214 |
| 2015 | $1,580 | $88,564 | $38,119 | $50,445 |
| 2014 | $1,538 | $86,830 | $37,373 | $49,457 |
Source: Public Records
Map
Nearby Homes
- 192 Mayhew Way
- 1014 Bancroft Rd
- 1218 Hookston Rd
- 54 Village Square Place
- 3183 Wayside Plaza Unit 308
- 3183 Wayside Plaza Unit 319
- 22 Village Square Place
- 1023 Bermuda Dr
- 1746 Candelero Ct
- 55 Normandy Ln
- 1520 Candelero Dr
- 1214 Honey Trail
- 100 Alderwood Rd
- 1013 Mohr Ln Unit 2
- 2463 Aarles Ct
- 2379 Geraldine Dr Unit 1
- 1520 Arkell Rd
- 1049 Mohr Ln Unit A
- 1045 Mohr Ln Unit B
- 1988 Pomar Way
- 915 Bancroft Rd
- 919 Bancroft Rd
- 427 Le Jean Way
- 433 Le Jean Way
- 421 Le Jean Way
- 913 Bancroft Rd
- 921 Bancroft Rd
- 916 Bancroft Rd
- 918 Bancroft Rd
- 445 Nora Ct
- 424 Mayhew Way
- 415 Le Jean Way
- 439 Le Jean Way
- 1211 Mccann Ct
- 1210 Traud Dr
- 922 Bancroft Rd
- 426 Le Jean Way
- 418 Mayhew Way
- 911 Bancroft Rd
- 451 Nora Ct
Your Personal Tour Guide
Ask me questions while you tour the home.