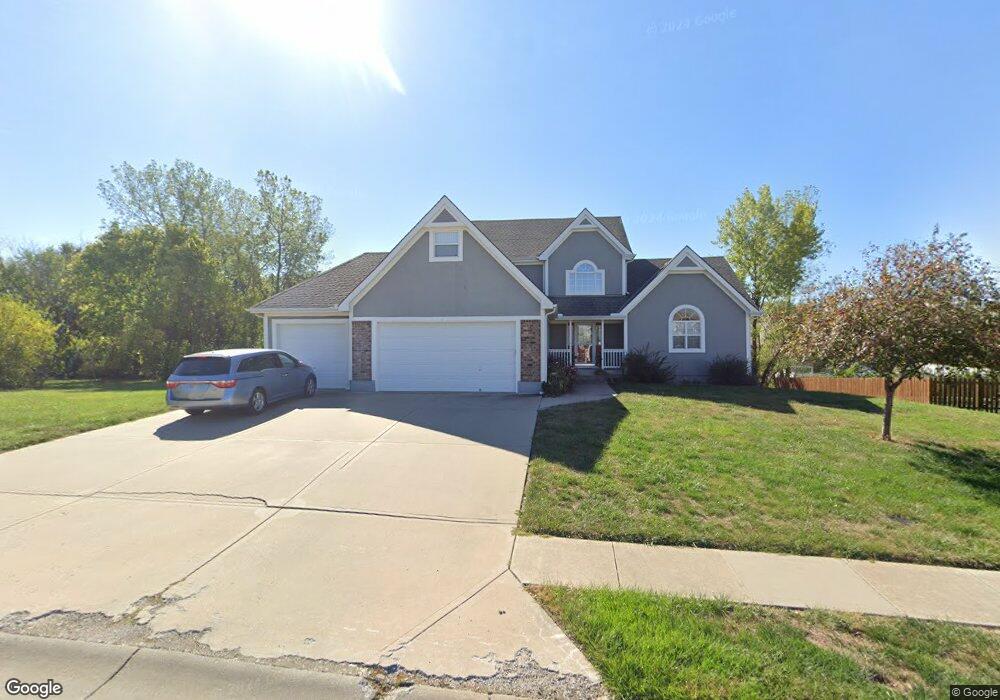
917 Birchwood Dr Raymore, MO 64083
Estimated Value: $476,843 - $513,000
4
Beds
2
Baths
2,538
Sq Ft
$198/Sq Ft
Est. Value
About This Home
This home is located at 917 Birchwood Dr, Raymore, MO 64083 and is currently estimated at $502,211, approximately $197 per square foot. 917 Birchwood Dr is a home located in Cass County with nearby schools including Bridle Ridge Intermediate School, Raymore-Peculiar South Middle School, and Raymore-Peculiar Senior High School.
Ownership History
Date
Name
Owned For
Owner Type
Purchase Details
Closed on
Jul 2, 2021
Sold by
Abdelgawad Aly and Abdelgawad Sonja E
Bought by
Abdelgawad Aly and Abdelgawad Sonja E
Current Estimated Value
Purchase Details
Closed on
Jun 20, 2007
Sold by
Pemberton And Ragan Construction Llc
Bought by
Abdelgawad Aly and Abdelgawad Sonja E
Home Financials for this Owner
Home Financials are based on the most recent Mortgage that was taken out on this home.
Original Mortgage
$249,900
Outstanding Balance
$205,048
Interest Rate
6.71%
Mortgage Type
New Conventional
Estimated Equity
$297,163
Purchase Details
Closed on
Mar 17, 2005
Sold by
Lbs Development Group Llc
Bought by
Pemberton And Ragan Construction Llc
Home Financials for this Owner
Home Financials are based on the most recent Mortgage that was taken out on this home.
Original Mortgage
$233,500
Interest Rate
5.67%
Mortgage Type
Construction
Create a Home Valuation Report for This Property
The Home Valuation Report is an in-depth analysis detailing your home's value as well as a comparison with similar homes in the area
Home Values in the Area
Average Home Value in this Area
Purchase History
| Date | Buyer | Sale Price | Title Company |
|---|---|---|---|
| Abdelgawad Aly | -- | None Available | |
| Abdelgawad Aly | -- | -- | |
| Pemberton And Ragan Construction Llc | -- | -- |
Source: Public Records
Mortgage History
| Date | Status | Borrower | Loan Amount |
|---|---|---|---|
| Open | Abdelgawad Aly | $249,900 | |
| Previous Owner | Pemberton And Ragan Construction Llc | $233,500 |
Source: Public Records
Tax History Compared to Growth
Tax History
| Year | Tax Paid | Tax Assessment Tax Assessment Total Assessment is a certain percentage of the fair market value that is determined by local assessors to be the total taxable value of land and additions on the property. | Land | Improvement |
|---|---|---|---|---|
| 2025 | $5,019 | $70,540 | $6,510 | $64,030 |
| 2024 | $5,019 | $61,670 | $5,920 | $55,750 |
| 2023 | $5,012 | $61,670 | $5,920 | $55,750 |
| 2022 | $4,609 | $56,340 | $5,920 | $50,420 |
| 2021 | $4,610 | $56,340 | $5,920 | $50,420 |
| 2020 | $4,568 | $54,840 | $5,920 | $48,920 |
| 2019 | $4,410 | $54,840 | $5,920 | $48,920 |
| 2018 | $4,097 | $49,200 | $5,050 | $44,150 |
| 2017 | $3,755 | $49,200 | $5,050 | $44,150 |
| 2016 | $3,755 | $46,810 | $5,050 | $41,760 |
| 2015 | $3,758 | $46,810 | $5,050 | $41,760 |
| 2014 | $3,760 | $46,810 | $5,050 | $41,760 |
| 2013 | -- | $46,810 | $5,050 | $41,760 |
Source: Public Records
Map
Nearby Homes
- 1002 E Hubach Hill Rd
- 0 Rd Unit HMS2556766
- 0 J Hwy & Lucy Webb Rd Unit HMS2556862
- 605 S Franklin St
- 528 S Saturn Dr
- 526 S Saturn Dr
- 0 E Hubach Hill Rd Unit HMS2575511
- Lot 12 Municipal Cir
- Lot 6 Municipal Cir
- Lot 13 Municipal Cir
- 700 E Saturn Dr
- 507 S Washington St
- 512 S Washington St
- 302 E Olive St
- Lot 1 Hubach Hill Rd
- 0 Missouri 58
- 808 Clancy Ct
- 1101 E Walnut St
- 1110 S Prairie Ln
- 112 W Grant Dr