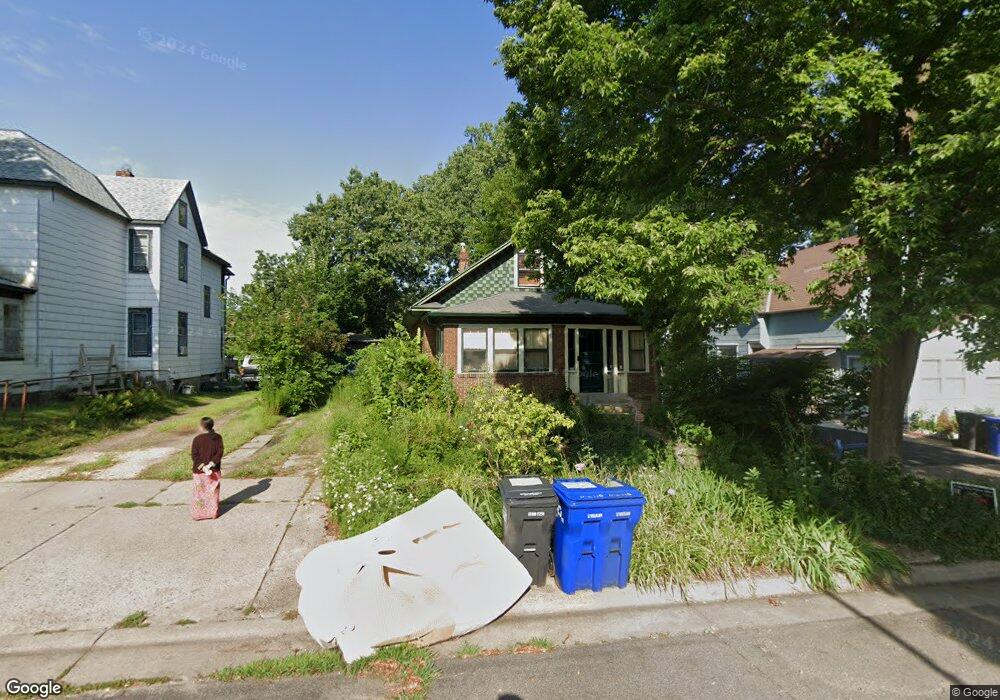
917 Clark St Saint Paul, MN 55130
Payne-Phalen NeighborhoodEstimated Value: $211,000 - $244,000
2
Beds
1
Bath
1,248
Sq Ft
$178/Sq Ft
Est. Value
About This Home
This home is located at 917 Clark St, Saint Paul, MN 55130 and is currently estimated at $221,652, approximately $177 per square foot. 917 Clark St is a home located in Ramsey County with nearby schools including Bruce F Vento Elementary School, Washington Technology Magnet School, and Community Of Peace Academy.
Ownership History
Date
Name
Owned For
Owner Type
Purchase Details
Closed on
Oct 22, 2015
Sold by
Cox Anthony S and Baker Susan Lynn
Bought by
Lewandowski Aaron D
Current Estimated Value
Home Financials for this Owner
Home Financials are based on the most recent Mortgage that was taken out on this home.
Original Mortgage
$111,813
Interest Rate
3.79%
Create a Home Valuation Report for This Property
The Home Valuation Report is an in-depth analysis detailing your home's value as well as a comparison with similar homes in the area
Home Values in the Area
Average Home Value in this Area
Purchase History
| Date | Buyer | Sale Price | Title Company |
|---|---|---|---|
| Lewandowski Aaron D | $114,369 | Cities Title Services Llc | |
| Lewandowski Aaron Aaron | $114,400 | -- |
Source: Public Records
Mortgage History
| Date | Status | Borrower | Loan Amount |
|---|---|---|---|
| Previous Owner | Lewandowski Aaron Aaron | $111,813 | |
| Previous Owner | Lewandowski Aaron D | $112,297 |
Source: Public Records
Tax History
| Year | Tax Paid | Tax Assessment Tax Assessment Total Assessment is a certain percentage of the fair market value that is determined by local assessors to be the total taxable value of land and additions on the property. | Land | Improvement |
|---|---|---|---|---|
| 2025 | $3,312 | $214,400 | $25,000 | $189,400 |
| 2023 | $3,312 | $191,900 | $20,000 | $171,900 |
| 2022 | $3,326 | $202,000 | $20,000 | $182,000 |
| 2021 | $2,902 | $166,900 | $20,000 | $146,900 |
| 2020 | $2,702 | $178,000 | $8,500 | $169,500 |
| 2019 | $2,116 | $162,000 | $8,500 | $153,500 |
| 2018 | $2,142 | $134,100 | $8,500 | $125,600 |
| 2017 | $2,100 | $118,800 | $8,500 | $110,300 |
| 2016 | $1,596 | $0 | $0 | $0 |
| 2015 | $1,402 | $53,200 | $8,500 | $44,700 |
| 2014 | $1,206 | $0 | $0 | $0 |
Source: Public Records
Map
Nearby Homes
Your Personal Tour Guide
Ask me questions while you tour the home.