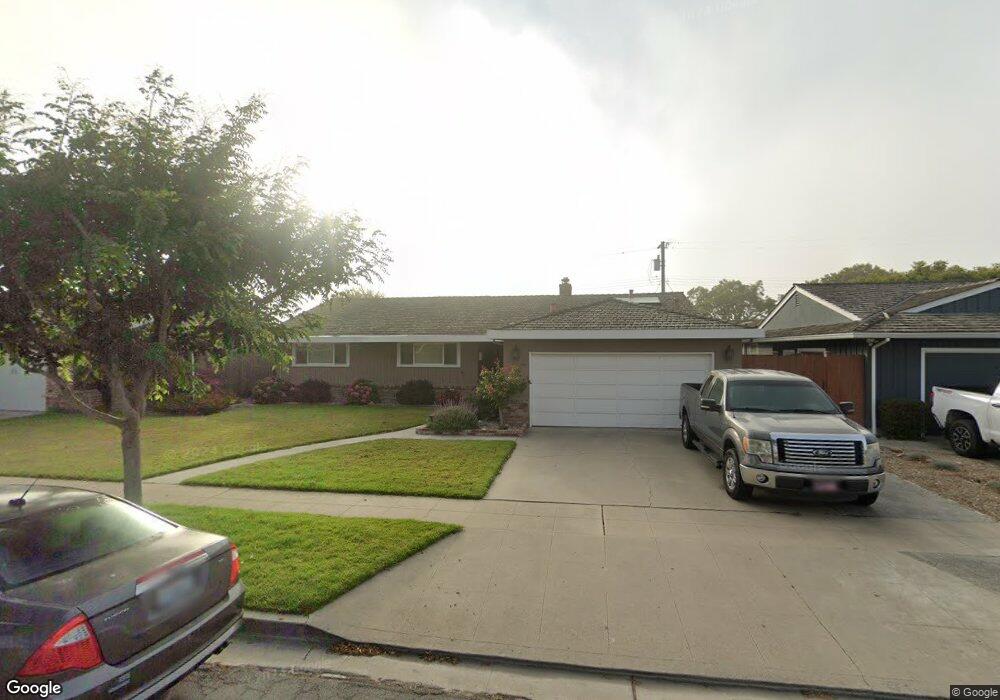
917 Crespi Way Salinas, CA 93901
South Salinas NeighborhoodEstimated Value: $800,000 - $887,000
3
Beds
3
Baths
2,171
Sq Ft
$390/Sq Ft
Est. Value
About This Home
This home is located at 917 Crespi Way, Salinas, CA 93901 and is currently estimated at $847,202, approximately $390 per square foot. 917 Crespi Way is a home located in Monterey County with nearby schools including Mission Park Elementary School, University Park Elementary School, and Lincoln Elementary School.
Ownership History
Date
Name
Owned For
Owner Type
Purchase Details
Closed on
Nov 13, 2019
Sold by
Heffernan James and Heffernan Shelly
Bought by
Heffernan James and Heffernan Shelly
Current Estimated Value
Purchase Details
Closed on
Jun 21, 2016
Sold by
Heffernan James
Bought by
Heffernan James and Heffernan Shelly
Purchase Details
Closed on
May 30, 2012
Sold by
Ramsey Bixby William and Ramsey Cobianna Kay
Bought by
Heffernan James
Home Financials for this Owner
Home Financials are based on the most recent Mortgage that was taken out on this home.
Original Mortgage
$358,388
Interest Rate
3.75%
Mortgage Type
FHA
Purchase Details
Closed on
Mar 29, 2012
Sold by
Borzini Debby and Berry Zayna
Bought by
Ramsey Bixby William and Ramsey Cobianna Kay
Purchase Details
Closed on
Jun 28, 2010
Sold by
Berry Zayna
Bought by
Berry Zayna and Zayna Berry Living Trust
Purchase Details
Closed on
Oct 3, 2007
Sold by
Berry Anna M
Bought by
Berry Zayna and Borzini Debby
Create a Home Valuation Report for This Property
The Home Valuation Report is an in-depth analysis detailing your home's value as well as a comparison with similar homes in the area
Home Values in the Area
Average Home Value in this Area
Purchase History
| Date | Buyer | Sale Price | Title Company |
|---|---|---|---|
| Heffernan James | -- | None Available | |
| Heffernan James | -- | None Available | |
| Heffernan James | $365,000 | Old Republic Title Company | |
| Ramsey Bixby William | -- | None Available | |
| Berry Zayna | -- | None Available | |
| Borzini Debby | -- | None Available | |
| Berry Zayna | -- | None Available | |
| Borzini Ray A | -- | None Available | |
| Berry Zayna | -- | None Available | |
| Berry Zayna | -- | None Available |
Source: Public Records
Mortgage History
| Date | Status | Borrower | Loan Amount |
|---|---|---|---|
| Previous Owner | Heffernan James | $358,388 |
Source: Public Records
Tax History Compared to Growth
Tax History
| Year | Tax Paid | Tax Assessment Tax Assessment Total Assessment is a certain percentage of the fair market value that is determined by local assessors to be the total taxable value of land and additions on the property. | Land | Improvement |
|---|---|---|---|---|
| 2025 | $5,175 | $458,447 | $94,198 | $364,249 |
| 2024 | $5,175 | $449,458 | $92,351 | $357,107 |
| 2023 | $4,999 | $440,646 | $90,541 | $350,105 |
| 2022 | $4,811 | $432,007 | $88,766 | $343,241 |
| 2021 | $4,620 | $423,537 | $87,026 | $336,511 |
| 2020 | $4,492 | $419,195 | $86,134 | $333,061 |
| 2019 | $4,458 | $410,977 | $84,446 | $326,531 |
| 2018 | $4,401 | $402,920 | $82,791 | $320,129 |
| 2017 | $4,403 | $395,020 | $81,168 | $313,852 |
| 2016 | $4,405 | $387,276 | $79,577 | $307,699 |
| 2015 | $4,443 | $381,460 | $78,382 | $303,078 |
| 2014 | $4,143 | $373,989 | $76,847 | $297,142 |
Source: Public Records
Map
Nearby Homes
- 929 Capistrano Dr
- 1007 Driftwood Place
- 330 Woodside Dr Unit 104
- 1051 Riker St Unit 7
- 1053 Riker St Unit 6
- 451 La Jolla Way
- 307 De la Vina Way
- 118 Nissen Rd Unit 1
- 1056 Padre Dr Unit 8
- 307 W Alisal St
- 1051 Padre Dr Unit 7
- 1223 La Canada Way
- 16 Orange Dr
- 1067 Padre Dr Unit 1
- 332 Capitol St
- 194 Riker Terrace
- 767 Lemos Ave
- 1310 Primavera St Unit 118
- 18 Chestnut St
- 36 Pine St
- 921 Crespi Way
- 913 Crespi Way
- 918 Junipero Way
- 922 Junipero Way
- 925 Crespi Way
- 907 Crespi Way
- 918 Crespi Way
- 926 Junipero Way
- 908 Junipero Way
- 922 Crespi Way
- 914 Crespi Way
- 929 Crespi Way
- 926 Crespi Way
- 349 W Acacia St
- 930 Junipero Way
- 930 Crespi Way
- 917 Junipero Way
- 933 Crespi Way
- 919 Junipero Way
- 996 Junipero Way