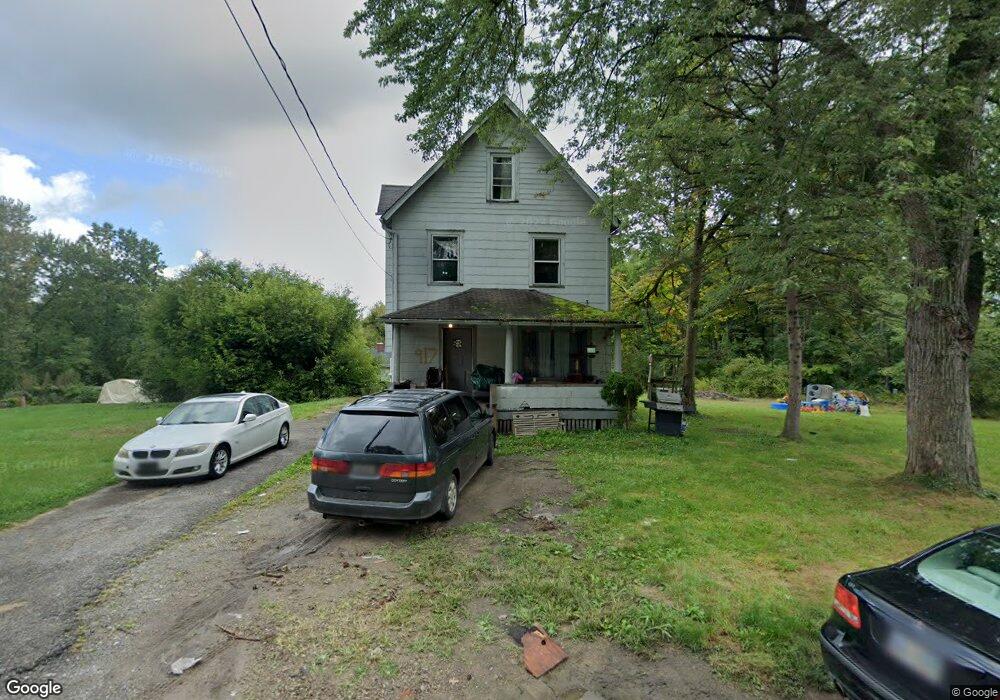
917 Devon Ave Youngstown, OH 44505
Landsdowne NeighborhoodEstimated Value: $50,000 - $77,000
3
Beds
1
Bath
1,372
Sq Ft
$44/Sq Ft
Est. Value
About This Home
This home is located at 917 Devon Ave, Youngstown, OH 44505 and is currently estimated at $60,442, approximately $44 per square foot. 917 Devon Ave is a home located in Mahoning County with nearby schools including M.L. King Elementary School, Williamson Elementary School, and East High School.
Ownership History
Date
Name
Owned For
Owner Type
Purchase Details
Closed on
Jul 6, 2023
Sold by
Fleurie Sheena
Bought by
Chapdelaine Sheila
Current Estimated Value
Purchase Details
Closed on
Dec 26, 2012
Sold by
Johnson Kathleen W
Bought by
Tourtellotte Sharon
Purchase Details
Closed on
Oct 25, 2004
Sold by
Jones Rena
Bought by
Wooten Allie Jean
Purchase Details
Closed on
Oct 18, 2004
Sold by
Grove Troy G and Grove Marsha
Bought by
Wooten Allie Jean
Purchase Details
Closed on
Sep 3, 2004
Sold by
Jones Wellington C
Bought by
Wooten Allie Jean
Purchase Details
Closed on
Aug 31, 2004
Sold by
Jones Nathaniel R and Jones Lillian H
Bought by
Wooten Allie Jean
Purchase Details
Closed on
Apr 13, 2001
Sold by
Estate Of Lillian J Rafe
Bought by
Jones Nathaniel R and Wooten Allie Jean
Purchase Details
Closed on
Jan 1, 1990
Bought by
Rafe Lillian J
Create a Home Valuation Report for This Property
The Home Valuation Report is an in-depth analysis detailing your home's value as well as a comparison with similar homes in the area
Home Values in the Area
Average Home Value in this Area
Purchase History
| Date | Buyer | Sale Price | Title Company |
|---|---|---|---|
| Chapdelaine Sheila | -- | None Listed On Document | |
| Chapdelaine Sheila | -- | None Listed On Document | |
| Tourtellotte Sharon | $5,000 | Attorney | |
| Wooten Allie Jean | -- | None Available | |
| Wooten Allie Jean | -- | None Available | |
| Wooten Allie Jean | -- | None Available | |
| Wooten Allie Jean | -- | None Available | |
| Jones Nathaniel R | -- | -- | |
| Rafe Lillian J | -- | -- |
Source: Public Records
Tax History
| Year | Tax Paid | Tax Assessment Tax Assessment Total Assessment is a certain percentage of the fair market value that is determined by local assessors to be the total taxable value of land and additions on the property. | Land | Improvement |
|---|---|---|---|---|
| 2025 | $202 | $4,750 | $400 | $4,350 |
| 2024 | $229 | $4,750 | $400 | $4,350 |
| 2023 | $233 | $4,750 | $400 | $4,350 |
| 2022 | $147 | $2,290 | $350 | $1,940 |
| 2021 | $147 | $2,290 | $350 | $1,940 |
| 2020 | $148 | $2,290 | $350 | $1,940 |
| 2019 | $155 | $2,120 | $320 | $1,800 |
| 2018 | $181 | $2,120 | $320 | $1,800 |
| 2017 | $154 | $2,120 | $320 | $1,800 |
| 2016 | $156 | $2,320 | $320 | $2,000 |
| 2015 | $161 | $2,320 | $320 | $2,000 |
| 2014 | $152 | $2,320 | $320 | $2,000 |
| 2013 | $150 | $2,320 | $320 | $2,000 |
Source: Public Records
Map
Nearby Homes
- 1003 Liberty Rd
- 2849 McGuffey Rd
- 603 Liberty Rd
- 575 Woodside Ave
- 1538 Republic Ave
- 1214 Brighton St
- 332 Lansdowne Blvd
- 1720 Jacobs Rd
- 598 Cassius Ave
- 1125 N Garland Ave
- 146 Greeley Ln
- 111 Bassett Ln
- 1585 Himrod Ave
- 58 Rutledge Dr
- 0 Mccartney Rd Unit 5030673
- 2508 Applegate Rd
- 3240 Oak Street Extension
- V/L Jacobs Rd
- 217 S Jackson St
- 0 Homestead Rd
- 923 Devon Ave
- 934 Alden Ave
- 918 Devon Ave
- 920 Devon Ave
- 916 Devon Ave
- 2355 McGuffey Rd
- 907 S Gray Ave
- 2323 McGuffey Rd
- 907 Alden Ave
- 2319 McGuffey Rd
- 933 Alden Ave
- 915 S Gray Ave
- 923 S Gray Ave
- 2307 McGuffey Rd
- 903 S Gray Ave
- 812 Devon Ave
- 2360 McGuffey Rd
- 2358 McGuffey Rd
- 2368 McGuffey Rd
- 2320 McGuffey Rd
Your Personal Tour Guide
Ask me questions while you tour the home.