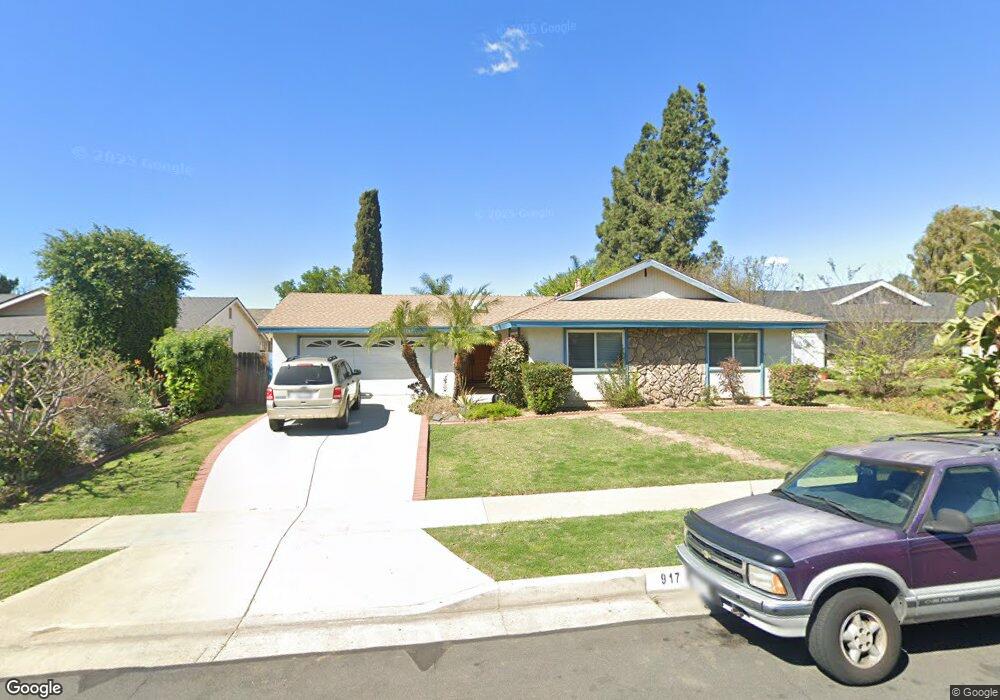
917 Diamond Rd Placentia, CA 92870
Estimated Value: $1,076,000 - $1,408,000
4
Beds
2
Baths
2,058
Sq Ft
$587/Sq Ft
Est. Value
About This Home
This home is located at 917 Diamond Rd, Placentia, CA 92870 and is currently estimated at $1,207,268, approximately $586 per square foot. 917 Diamond Rd is a home located in Orange County with nearby schools including Ruby Drive Elementary School, Kraemer Middle School, and Valencia High School.
Ownership History
Date
Name
Owned For
Owner Type
Purchase Details
Closed on
Jan 17, 2011
Sold by
Cardenas Thomas Manuel and Cardenas Mayra Patricia
Bought by
Tang Steve and Vuong Linh Tong
Current Estimated Value
Home Financials for this Owner
Home Financials are based on the most recent Mortgage that was taken out on this home.
Original Mortgage
$315,000
Outstanding Balance
$214,859
Interest Rate
4.79%
Mortgage Type
New Conventional
Estimated Equity
$992,409
Purchase Details
Closed on
Mar 23, 2004
Sold by
Gag Stanley R and Gag June T
Bought by
Cardenas Ii Thomas Manuel and Cardenas Mayra Patricia
Home Financials for this Owner
Home Financials are based on the most recent Mortgage that was taken out on this home.
Original Mortgage
$340,000
Interest Rate
5.45%
Mortgage Type
Purchase Money Mortgage
Create a Home Valuation Report for This Property
The Home Valuation Report is an in-depth analysis detailing your home's value as well as a comparison with similar homes in the area
Home Values in the Area
Average Home Value in this Area
Purchase History
| Date | Buyer | Sale Price | Title Company |
|---|---|---|---|
| Tang Steve | $420,000 | Fidelity National Title | |
| Cardenas Ii Thomas Manuel | $490,000 | Commonwealth Land & Title Co |
Source: Public Records
Mortgage History
| Date | Status | Borrower | Loan Amount |
|---|---|---|---|
| Open | Tang Steve | $315,000 | |
| Previous Owner | Cardenas Ii Thomas Manuel | $340,000 |
Source: Public Records
Tax History Compared to Growth
Tax History
| Year | Tax Paid | Tax Assessment Tax Assessment Total Assessment is a certain percentage of the fair market value that is determined by local assessors to be the total taxable value of land and additions on the property. | Land | Improvement |
|---|---|---|---|---|
| 2025 | $6,470 | $538,088 | $426,162 | $111,926 |
| 2024 | $6,470 | $527,538 | $417,806 | $109,732 |
| 2023 | $6,331 | $517,195 | $409,614 | $107,581 |
| 2022 | $6,233 | $507,054 | $401,582 | $105,472 |
| 2021 | $6,081 | $497,112 | $393,708 | $103,404 |
| 2020 | $6,099 | $492,015 | $389,671 | $102,344 |
| 2019 | $5,856 | $482,368 | $382,030 | $100,338 |
| 2018 | $5,780 | $472,910 | $374,539 | $98,371 |
| 2017 | $5,682 | $463,638 | $367,195 | $96,443 |
| 2016 | $5,569 | $454,548 | $359,996 | $94,552 |
| 2015 | $5,497 | $447,721 | $354,589 | $93,132 |
| 2014 | $5,342 | $438,951 | $347,643 | $91,308 |
Source: Public Records
Map
Nearby Homes
- 123 Orange Grove Ave
- 724 Stardust Dr
- 3116 Quartz Ln
- 1305 Cameo Ln
- 3124 Pearl Dr
- 1260 N Placentia Ave
- 3117 Pearl Dr
- 3136 Garnet Ln
- 2900 Madison Ave Unit B12
- 3119 Garnet Ln
- 3225 Topaz Ln
- 3100 Garnet Ln
- 401 Stardust Dr
- 166 Southampton Way Unit 21
- 3037 Garnet Ln
- 186 Southampton Way Unit 29
- 744 N Angelina Dr
- 607 Valley Forge Dr
- 3049 Topaz Ln
- 3043 Topaz Ln